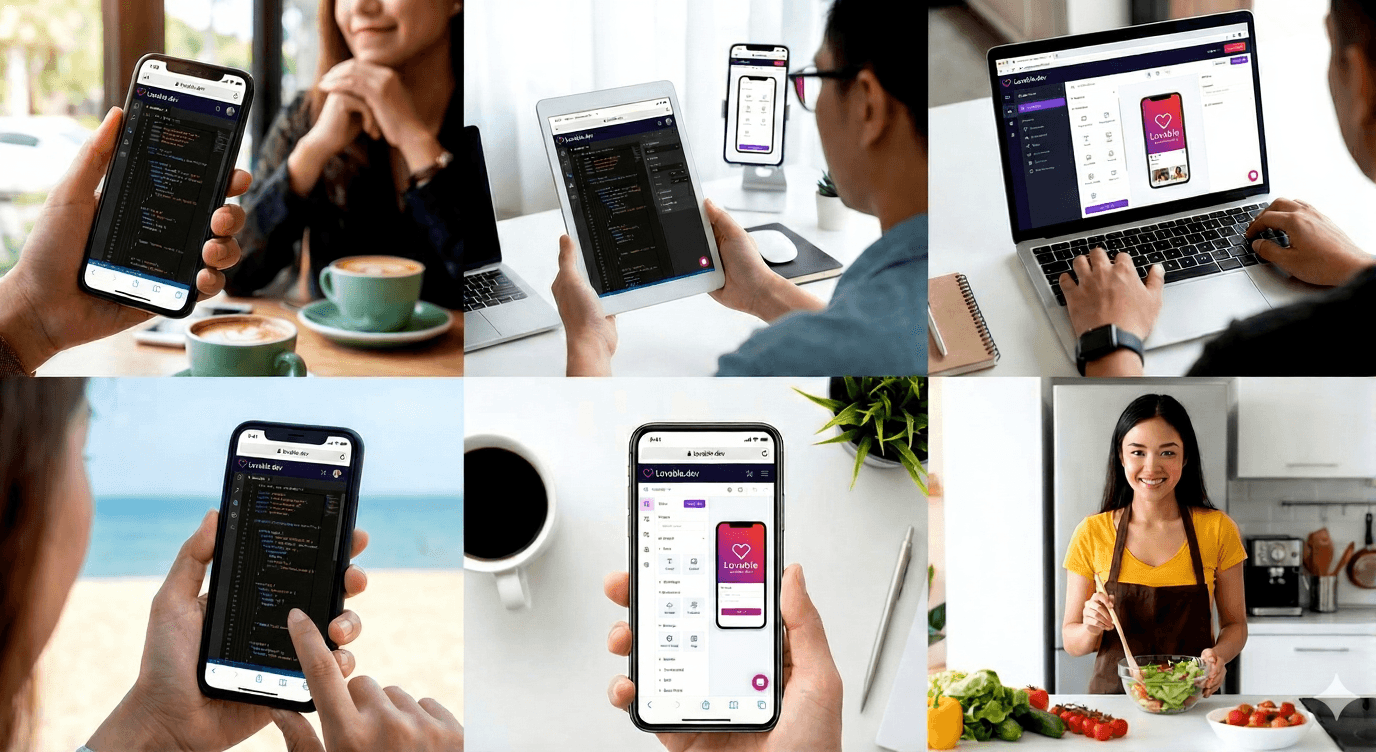
Inside the playbook, creator ecosystem, and cross-channel strategy behind one of 2025’s fastest growing AI startups
[Download the Influencer list] Reach out to me
Overview
2025 has been the year of AI hyper-growth — with thousands of new products launching, evolving, and competing for user attention every week.
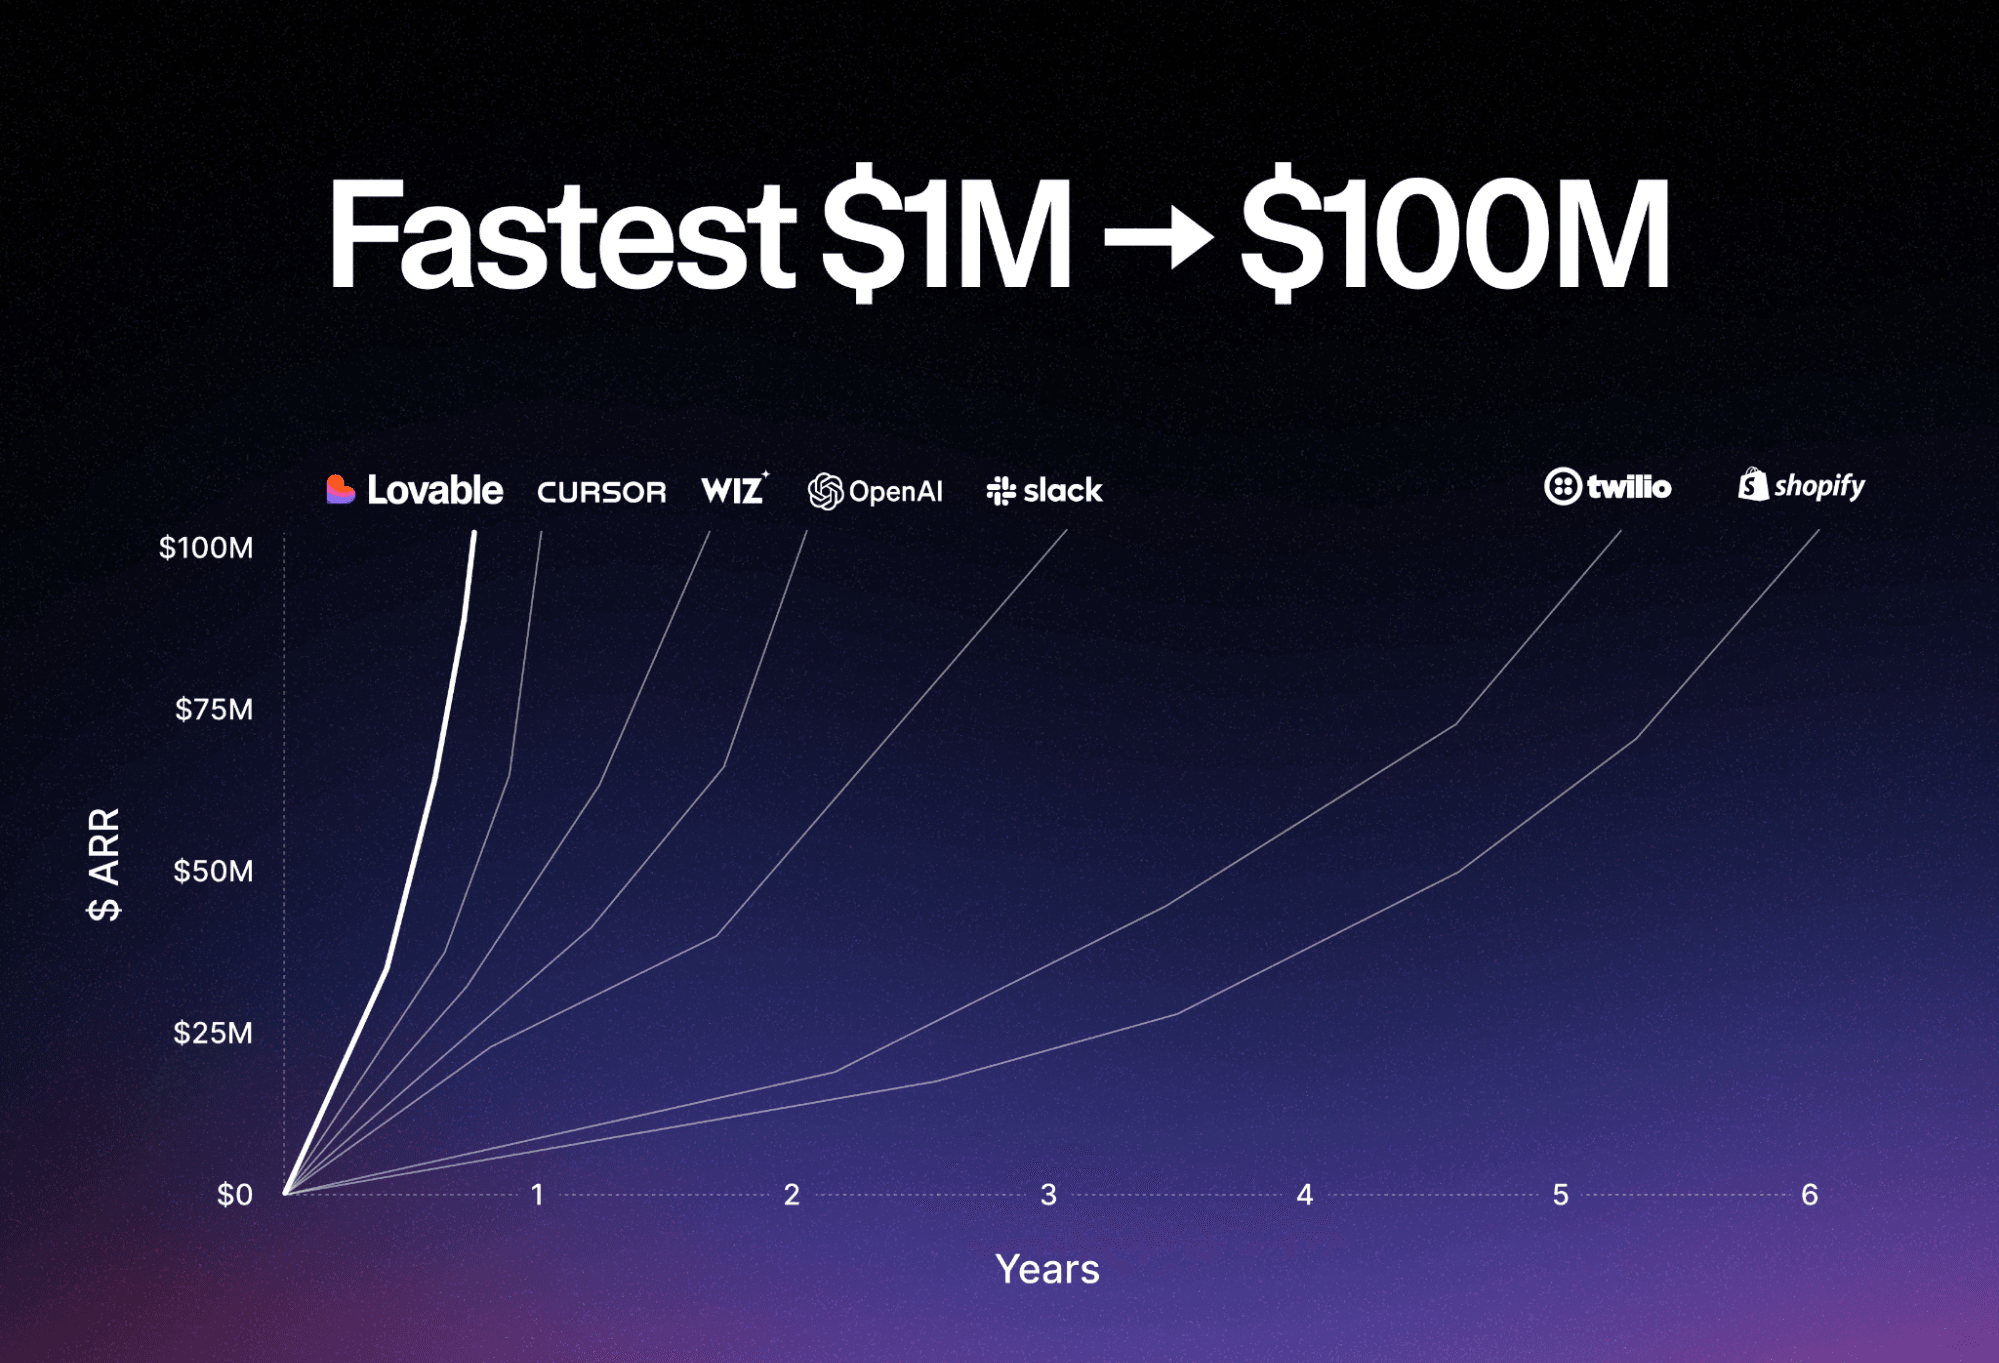
Among them, Lovable stands out as one of the most spectacular success stories in the creator-driven tech ecosystem: a product that enables anyone to build apps without code — and reached $100M ARR within just eight months.
But behind this explosive rise lies more than just a good product. Lovable’s secret weapon is its data-informed influencer marketing strategy — a cross-platform engine that combines storytelling, authenticity, and experimentation.
Using Amplift, we analyzed Lovable’s influencer network across YouTube, X (Twitter), TikTok, and Instagram, breaking down their creator tiers, content patterns, audience sentiment, and engagement performance.
This article reveals how Lovable engineered visibility and trust at scale — and the replicable techniques that marketers and founders can adapt for their own growth strategies.
If you want to get the full list of influencers that Lovable has collaborated with, leave an email here or send an email to raul@sophiapro.ai. We will send you the full report and influencer spreadsheet shortly.
[button] Get Lovable’s Influencer List
Executive Summary
Lovable’s influencer marketing strategy is a case study in product-led virality and platform-specific precision.
Rather than relying on mass sponsorships, Lovable’s team built an ecosystem of credible creators, real users, and micro-communities — each reinforcing the product’s value through authentic storytelling.
Amplift’s data indicates that Lovable has invested an estimated $217.9K–$452.2K in influencer marketing, strategically spreading spend across all major channels—each playing a distinct role in the growth engine.
- YouTube ($89.2K–$212.1K):
Lovable’s largest investment, driving deep trust and education through long-form tutorials, breakdowns, and high-context product storytelling. - Twitter/X ($2.9K–$7.3K):
Used for real-time awareness and thought leadership, amplified heavily through founders and team members who act as always-on advocates. - TikTok ($95K–$140K):
Fuels top-of-funnel discovery with viral “build challenges,” fast demos, and snackable use-case content that spreads quickly. - Instagram ($30.8K–$92.8K):
Sustains community trust with UGC, micro-creator storytelling, and social proof that reinforces Lovable’s credibility across peer networks.
Together, these channels form a multi-layered growth engine, where product narrative, creator authenticity, and audience resonance work in sync — not by accident, but by design.
Key Takeaways & Actionable Insights
| Platform | Key Tactic | Data-Backed Result / Strategic Role | Actionable Insight |
|---|---|---|---|
| YouTube | Optimize for 20+ Minute Content | Videos over 20 minutes showed the strongest performance, with 34% rated as “good” or “excellent.” | Invest in 20+ minute dedicated video reviews and deep-dive tutorials; this length builds the highest trust and conversion rates. |
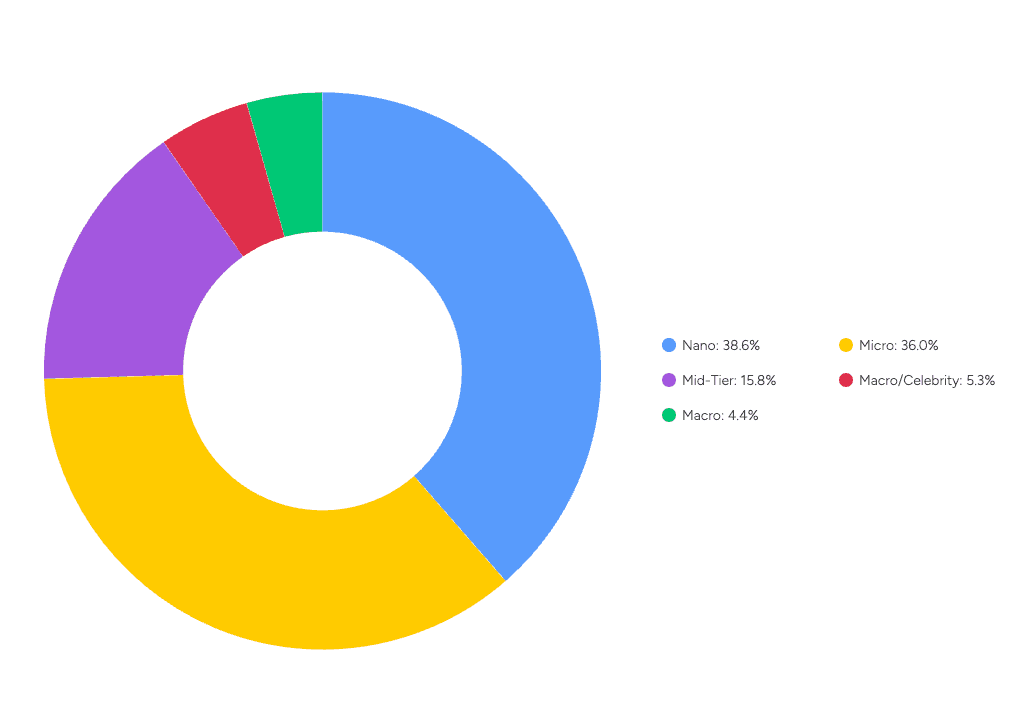
| Balance Tiers for Authenticity | The creator mix is intentionally focused on 38% Nano, 36% Micro, and 16% Mid-tier creators (74% are Nano/Micro). | Prioritize Micro and Mid-tier partnerships for niche authority and genuine advocacy over pure reach from Mega influencers. | |
| Cost-Efficient "Listicles for Reach" | Listicle videos (e.g., "15 AI Tools...") are used for affordable discovery by grouping Lovable with non-competing tools. | Treat list videos as a cost-efficient discovery hack to expand top-of-funnel reach without dedicated sponsorship expense. | |
| X (Twitter) | Activate the Grassroots Network | 86.7% of influencer mentions come from “Below Nano” creators (fewer than 1,000 followers), indicating powerful organic user advocacy. | Design community initiatives that excite your smallest user base to share organically, creating authentic buzz that paid efforts cannot replicate. |
| Anchor to Innovation | Product Feature Update posts consistently achieve the highest engagement rates (e.g., Shopify integration announcement). | Use Twitter as the primary channel for technical storytelling and real-time feature announcements; innovation narratives convert directly into visibility. | |
| TikTok | Adopt "Shock, Speed, and Shareability" | The most viral content is the Viral Build Showcase, using short, high-impact clips to focus on speed and "wow-factor" (e.g., "Building Call of Duty in 60 Seconds" with 1.8M views). | Package product demos as a dramatic, time-bound challenge: Bold Challenge + Short Build + Big Reveal to align with TikTok’s native virality. |
| Adhere to Optimal Video Length | 15–30 second videos deliver the highest average engagement rate, with a noticeable drop after 60 seconds. | Strictly limit video length to under 45 seconds to prevent the drop in engagement that occurs in longer-form content. | |
| Sustain Community Trust via UGC | The platform is used to sustain community trust through organic UGC, micro-tribes, and peer-to-peer storytelling. Its role is to maintain ongoing connection after initial discovery/conversion. | Focus on empowering users and micro-communities to generate and share authentic content, using the channel primarily for community reinforcement and loyalty rather than a primary engine for top-of-funnel growth or education. |
✨ In Short
Lovable didn’t rely on hype — it built an ecosystem of trust, storytelling, and user-driven discovery, showing that true virality comes from clear strategy and authentic creativity.
The Star Product Lovable and its Exponential Growth
Among the thousands of new AI launches this year, Lovable stands out as the breakout star. If there were an “Oscar list” for AI products, Lovable would absolutely be on it.
The company’s viral growth story (you can read this article from TechCrunch to find more) has wowed the tech and marketing community alike. In less than a year, Lovable achieved $17 million in Annual Recurring Revenue (ARR) within just three months after launch, and skyrocketed to $100 million ARR in eight months — a pace rarely seen even in Silicon Valley. It’s a case study every marketer should study, especially for understanding how influencer marketing can accelerate product adoption and brand credibility in the AI space.
What is Lovable?
Lovable is a Swedish AI startup founded in 2023 by Anton Osika and Fabian Hedin, headquartered in Stockholm. The company’s mission is straightforward yet revolutionary:
Empower anyone to build software — no coding required.
Through its AI app-building platform, Lovable allows users to chat their ideas into reality. You simply describe the app you want, and Lovable generates everything — from the front-end design to the backend logic and deployment. This all-in-one experience has made it one of the most talked-about AI productivity tools of 2025(Check more reviews about Lovable on ProductHunt).
Lovable’s Explosive Growth Statistics
Lovable’s growth curve is legendary — here’s how fast it scaled:
| Timeline | Key Milestone |
|---|---|
| Month 1 | $4 million ARR |
| Month 2 | $10 million ARR |
| Month 3 | $15 million Pre-A investment |
| Month 4 | $75 million ARR, $1.8 billion valuation |
| Month 5 | $100 million ARR – industry record |
As of mid-2025, Lovable has:
2.3 million active users worldwide
180,000 + paying customers
2.5 million websites built using Lovable, representing over 10 % of all new websites created on the internet this year
(Data sourced from TechCrunch)
These numbers position Lovable as one of the fastest-growing AI startups in the world, outpacing most no-code and low-code platforms that came before it.
Lovable’s Strategy Overview
Lovable’s influencer marketing isn’t built on campaigns — it’s built on systems.
Here is a breakdown of Lovable‘s influencer marketing strategy (built using Miro app). Each colored branch breaks down goals, creator types, content formats, and key learnings by platform—so you can quickly see what’s driving results on TikTok, Instagram, YouTube, and X, and how all of it connects into one repeatable system.
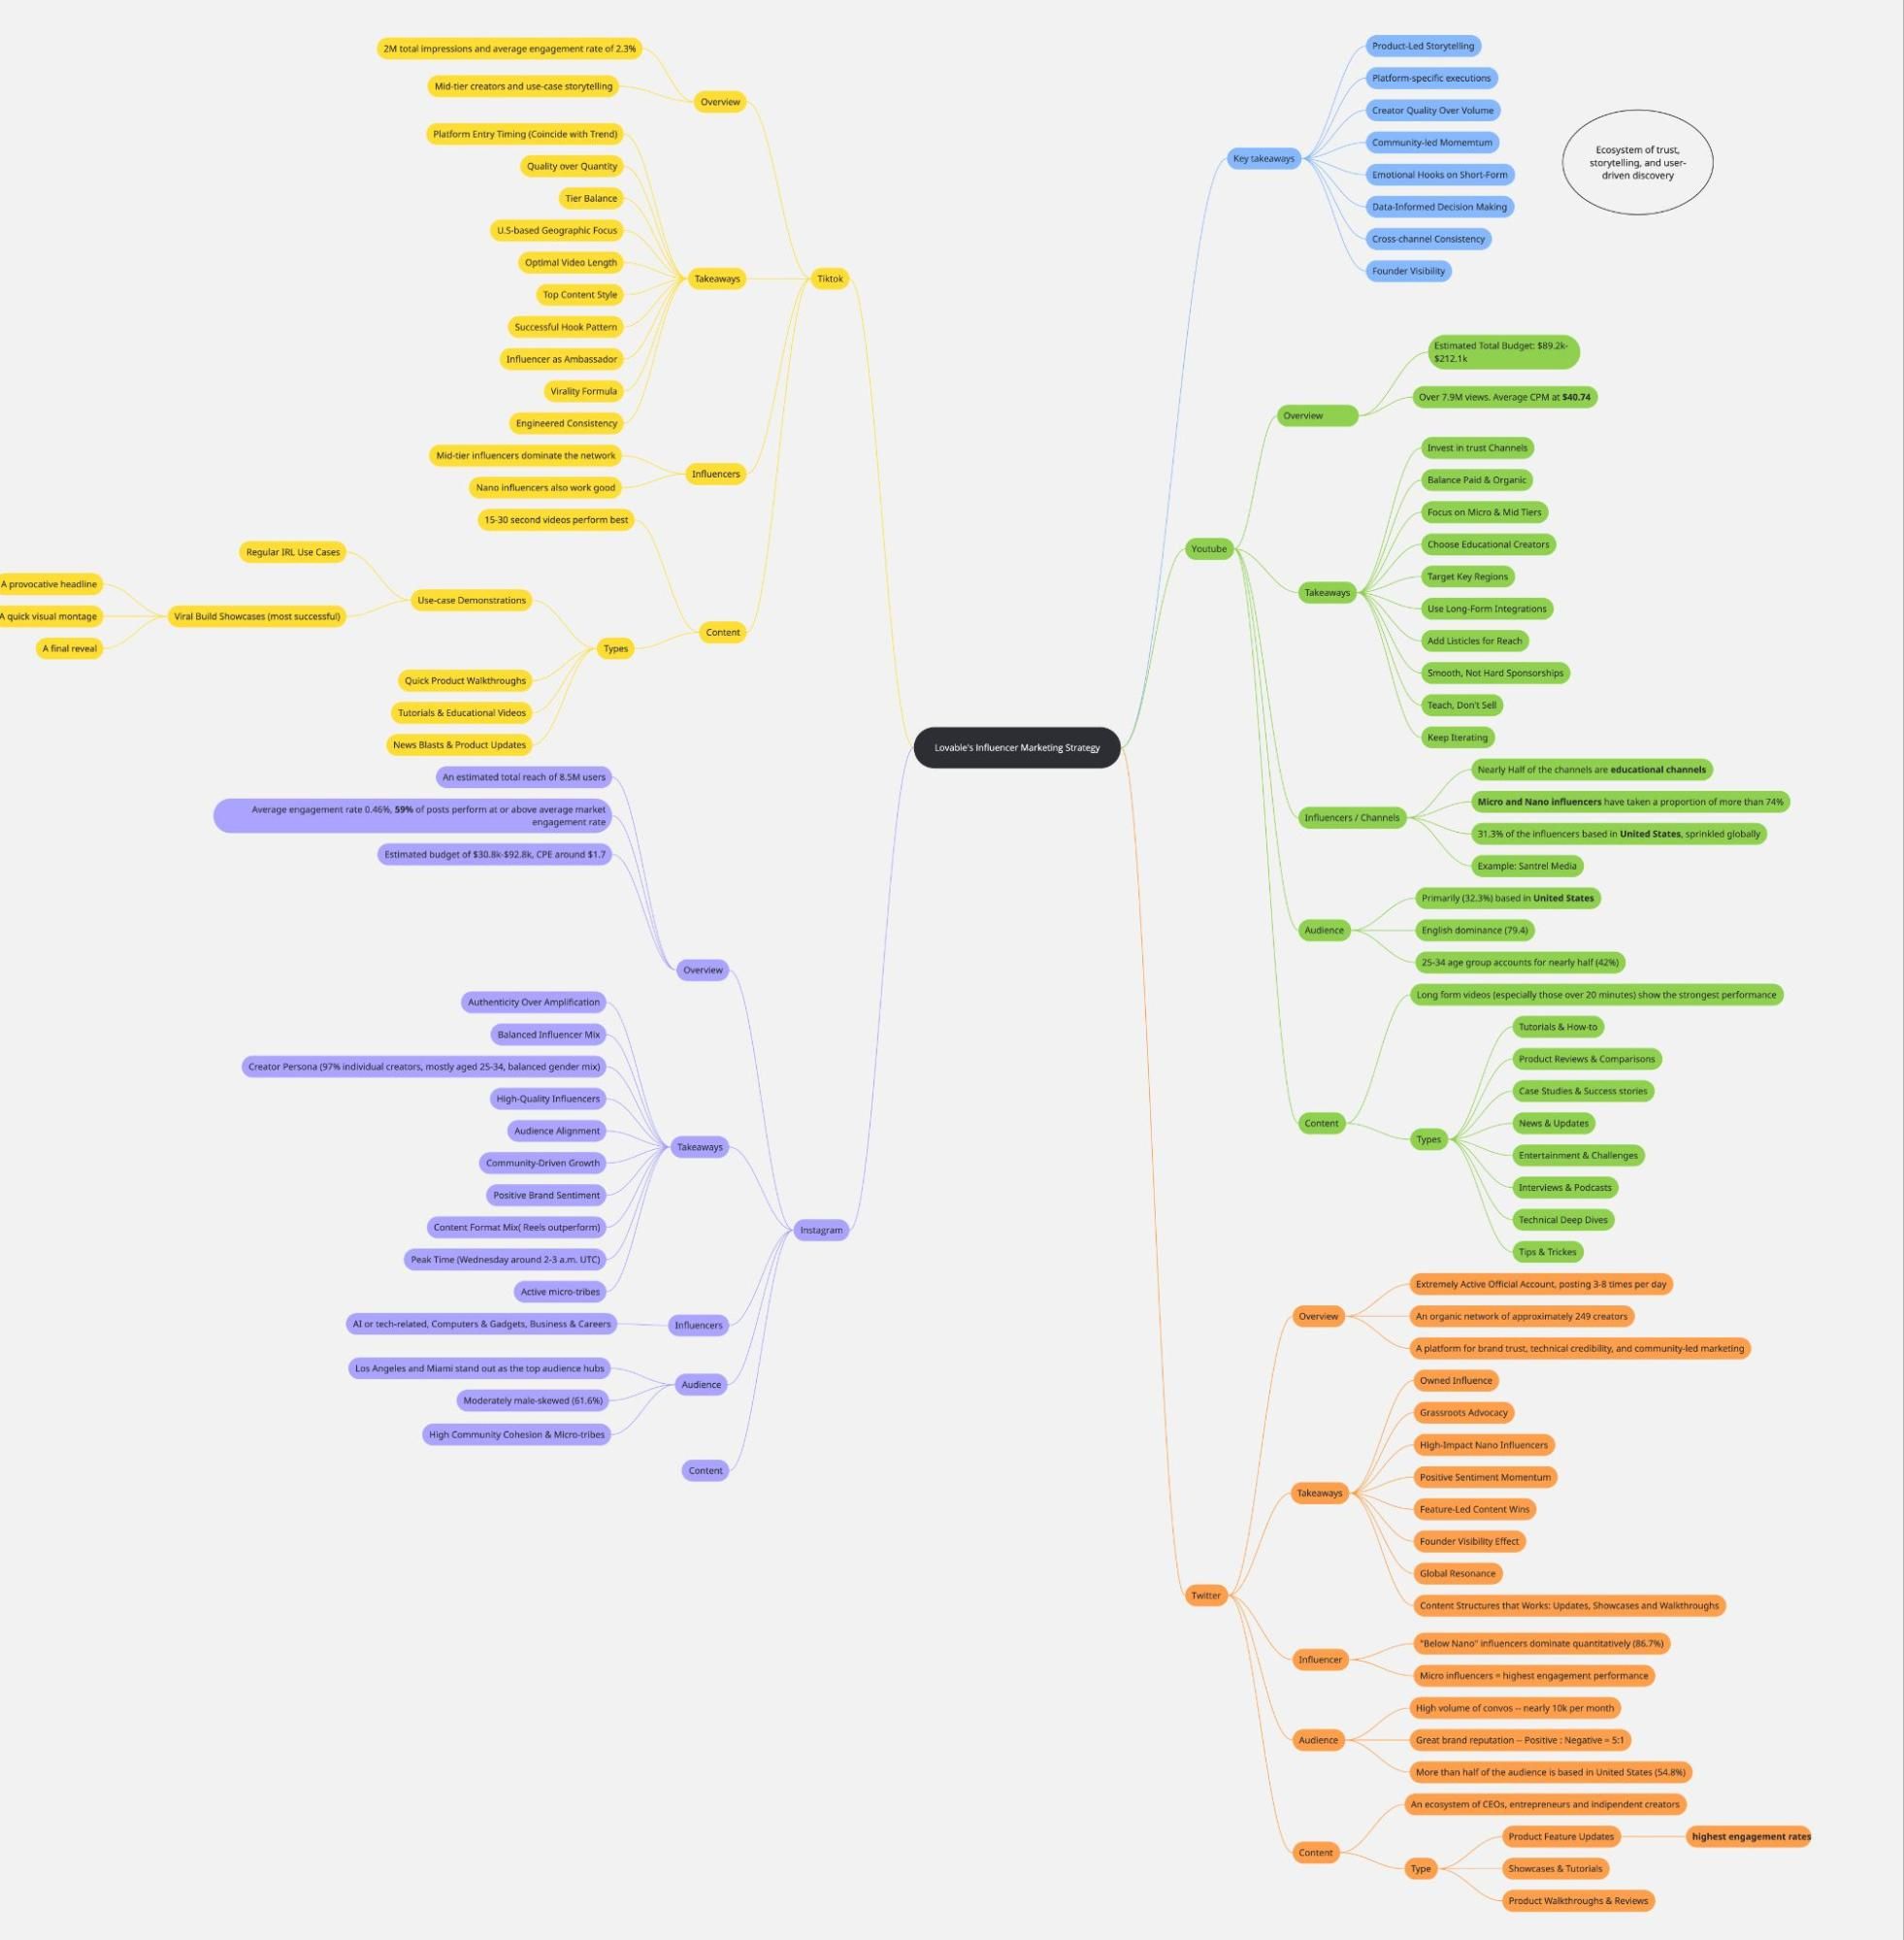
✨ In Short
- TikTok is used to spark discovery and virality with short, use-case stories;
- Instagram builds social proof through curated creators and community content; YouTube drives deep education with long-form tutorials and reviews;
- X (Twitter) amplifies product updates, founder voice, and real-time conversations.
Across every channel, the strategy leans on product-led storytelling, trusted micro and nano creators, and data-driven iteration to keep the flywheel compounding over time.
We will now delve into the specifics of each channel.
Lovable’s Youtube Strategy: The Trust Loop - Educate, Prove, Convert
YouTube is a vital marketing channel for Lovable, a business productivity web app. Given the significant influencer prices in the AI niche, Lovable has made a substantial investment in this naturally aligned channel.
Overview
In our analysis, 447 YouTube videos were identified that directly mentioned @Lovable.dev or included links to its official website, spanning a total of 228 creator channels. The average CPM across these collaborations was $40.74,ranging from $1.35 to $589.24 depending on creator tier and audience niche. Collectively, these videos have generated approximately 7.9 million views, representing an estimated total investment of $89.2K–$212.1K.
Notably, the majority of participating channels achieved an Amplift account quality score above 60, which is considered strong — indicating high topical relevance, content quality, and consistent engagement performance within the AI and tech education verticals.
Key Takeaways and Techniques you can ship:
| Key Tactic | Data-Backed Result / Strategic Role | Actionable Insight you can apply |
|---|---|---|
| Optimize for 20+ Minute Content | Videos over 20 minutes showed the strongest performance, with 34% rated as “good” or “excellent,” suggesting depth builds trust. | Invest in 20+ minute dedicated video reviews and deep-dive tutorials; this extended length is proven to build the highest trust and conversion rates. |
| Focus on Micro & Mid-tier Tiers | The creator mix is intentionally focused on 38% Nano, 36% Micro, and 16% Mid-tier creators (74% are Nano/Micro), prioritizing authentic engagement over pure reach. | Prioritize Micro and Mid-tier partnerships for niche authority and genuine advocacy over pure reach from Mega influencers, balancing cost efficiency with authenticity. |
| Leverage Cost-Efficient Listicles | Listicle videos (e.g., "15 AI Tools...") are used for affordable discovery by grouping Lovable with non-competing tools, working well for comparative strengths. | Treat list videos as a cost-efficient discovery hack to expand top-of-funnel reach without dedicated sponsorship expense, positioning the product alongside other relevant tools. |
| Target Educational Channels | Educational content dominates the influencer network, accounting for 49.3% of Lovable’s total influencer network (104 channels), followed by science/technology. | Partner with creators who teach, build, and add real value, such as those specializing in business tutorials, AI tools, and digital growth, to align with a learn-by-doing brand. |
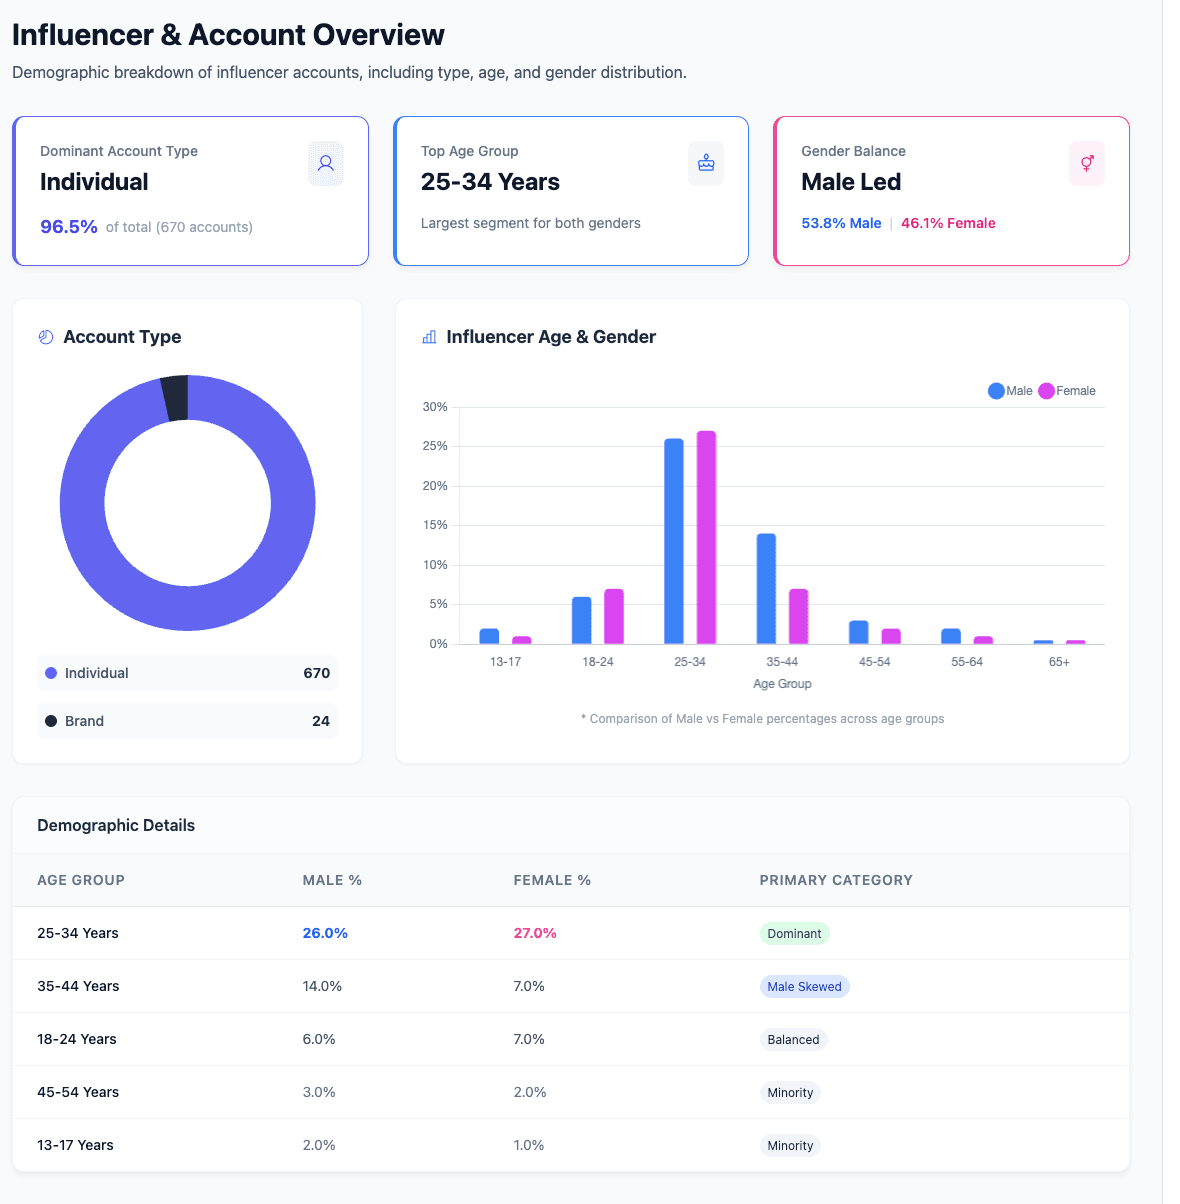
| Target the Core Demographic | The core audience demographic is male (71.7%) with the 25-34 age group accounting for 42%. | Tailor content and tone to appeal to this core demographic of young to middle-aged male tech enthusiasts and creators. |
| Utilize Tutorials & How-to Content | This is a primary content category, focused on step-by-step guides for building apps, websites, or using AI tools. | Continuously commission step-by-step tutorial videos (e.g., "Master Lovable in 17 minutes") to drive product adoption and utility. |
*
Channels Breakdown: Educational Channels with Micro sizes lead the way
Channels Tier
Across a total of 228 influencers, the majority belong to the Nano(38.6%), Micro(36%), and Mid-tier(15.8%) categories, while Macro(4.4%) and Mega(5.3%) influencers contribute only a small portion of Lovable’s overall collaborations.
However, this distribution does not necessarily indicate heavy investment in Nano creators. Smaller influencers often have a higher tendency to organically advocate for products they genuinely use or believe in — meaning that a significant portion of this activity may be voluntary rather than sponsored.
Instead, Lovable’s influencer mix reflects a strategic balance across tiers, with a deliberate emphasis on the lower funnel — prioritizing creators who drive authentic engagement, product usage, and community credibility over pure reach. This approach allows Lovable to blend cost efficiency with authenticity, sustaining long-term word-of-mouth momentum while still maintaining scalable visibility through mid-tier partnerships.
Channels Persona
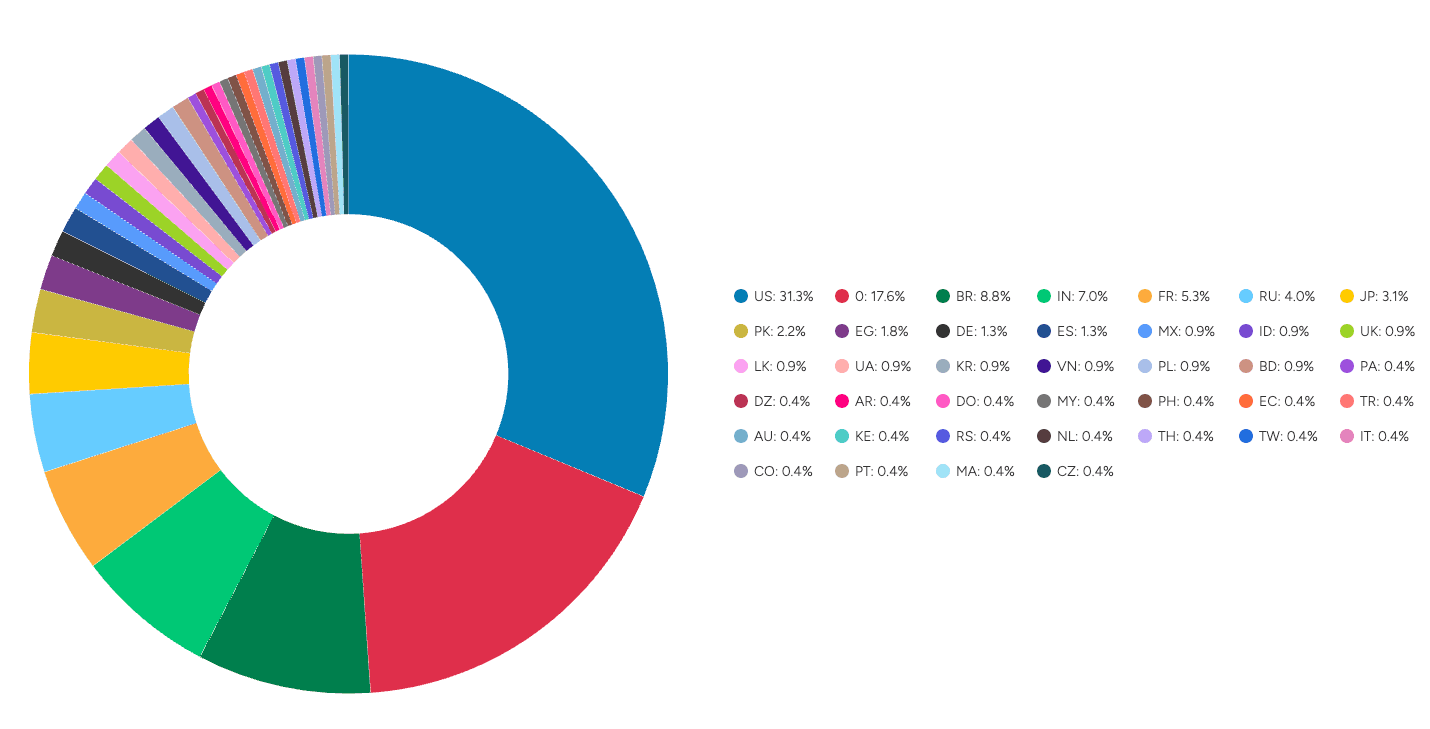
Lovable’s Youtube influencer channels are predominantly education-driven and U.S.-based, reflecting the brand’s strong presence among creators who teach, build, and share practical AI applications.
Geographically, the majority of Lovable’s influencer channels are based in the United States (31.3%), followed by Brazil (8.8%) and the United Kingdom (7.6%) — each contributing roughly 14% combined of the total distribution. This indicates a strong concentration of influencer activity in English-speaking and emerging tech markets, where AI-driven tools and productivity content perform exceptionally well.
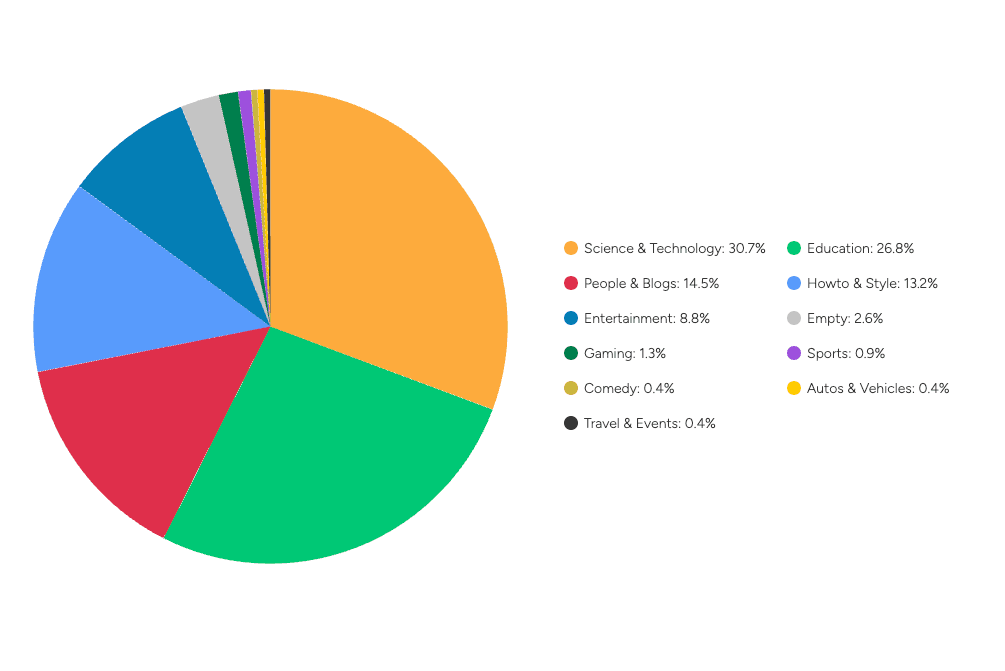
When analyzing channel categories, educational content dominates the landscape, accounting for 49.3% (104 channels) of Lovable’s total influencer network. This is followed by science and technology channels and how-to/style creators.
A great example of these creators is Santrel Media, who is a huge marketing solutions content creator with over 1.08 million followers in the United States – A mega Influencer.
According to Amplift,
Santrel Media's content focuses on step-by-step business and technology tutorials—specifically covering:
• E-commerce store management and product sales models (Shopify, Amazon FBA, Dropshipping, Print on Demand, selling Digital Products, selling Stickers, Etsy, Gelato, Helium 10, DSers),
• AI-powered development and automation tools (No-code/AI builders like Base44, Lovable, Hostinger Horizons, Vibe, n8n, and generative platforms like ChatGPT, Google AI Studio, and Google Notebook LM),
• Digital marketing strategies and essential business infrastructure (paid advertising on TikTok, Facebook/Meta, and Snapchat, email/newsletter platforms like Omnisend and Beehiiv, and website builders including Hostinger, Wix, and Squarespace),
—equipping viewers with practical skills to launch and scale modern online ventures.
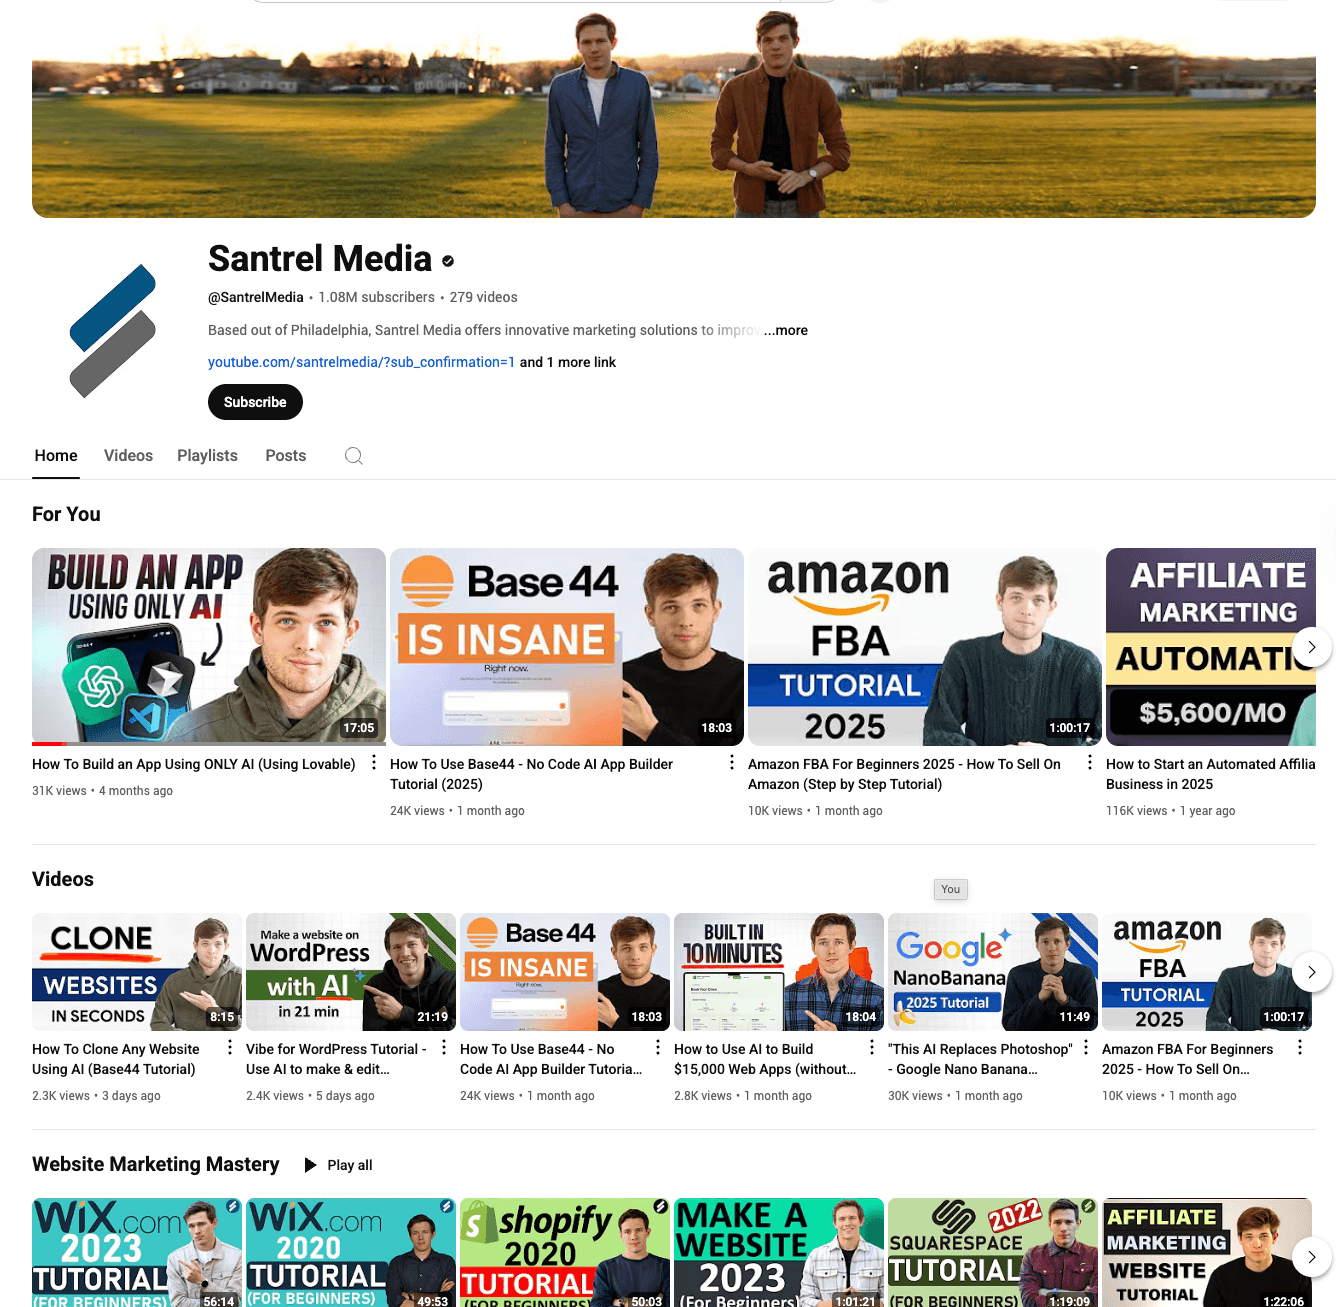
This example shows Lovable’s focus on partnering with creators who teach, build, and add real value. Santrel Media’s expertise in business tutorials(example:Shopify Tutorial for Beginners), AI tools(example: How To Build an App Using ONLY AI), and digital growth(example:How To Get 1000 subscribers And 4000 Hours Watch Time) fits perfectly with Lovable’s learn-by-doing brand.
Audience
Lovable’s YouTube audience is predominantly based in the United States (32.3%), followed by India (7.5%), and the United Kingdom (6.2%). This geographic distribution highlights a strong concentration in English-speaking markets with significant tech and creator communities, aligning with Lovable's global reach and its appeal to a diverse, yet targeted, user base. The presence of India also indicates Lovable's growing influence in emerging tech hubs. English dominates audience languages (79.4%), reinforcing the appeal to English-speaking regions. Males represent a significant portion of the audience (71.7%), with the 25-34 age group accounting for 42%, indicating a core demographic of young to middle-aged male tech enthusiasts and creators.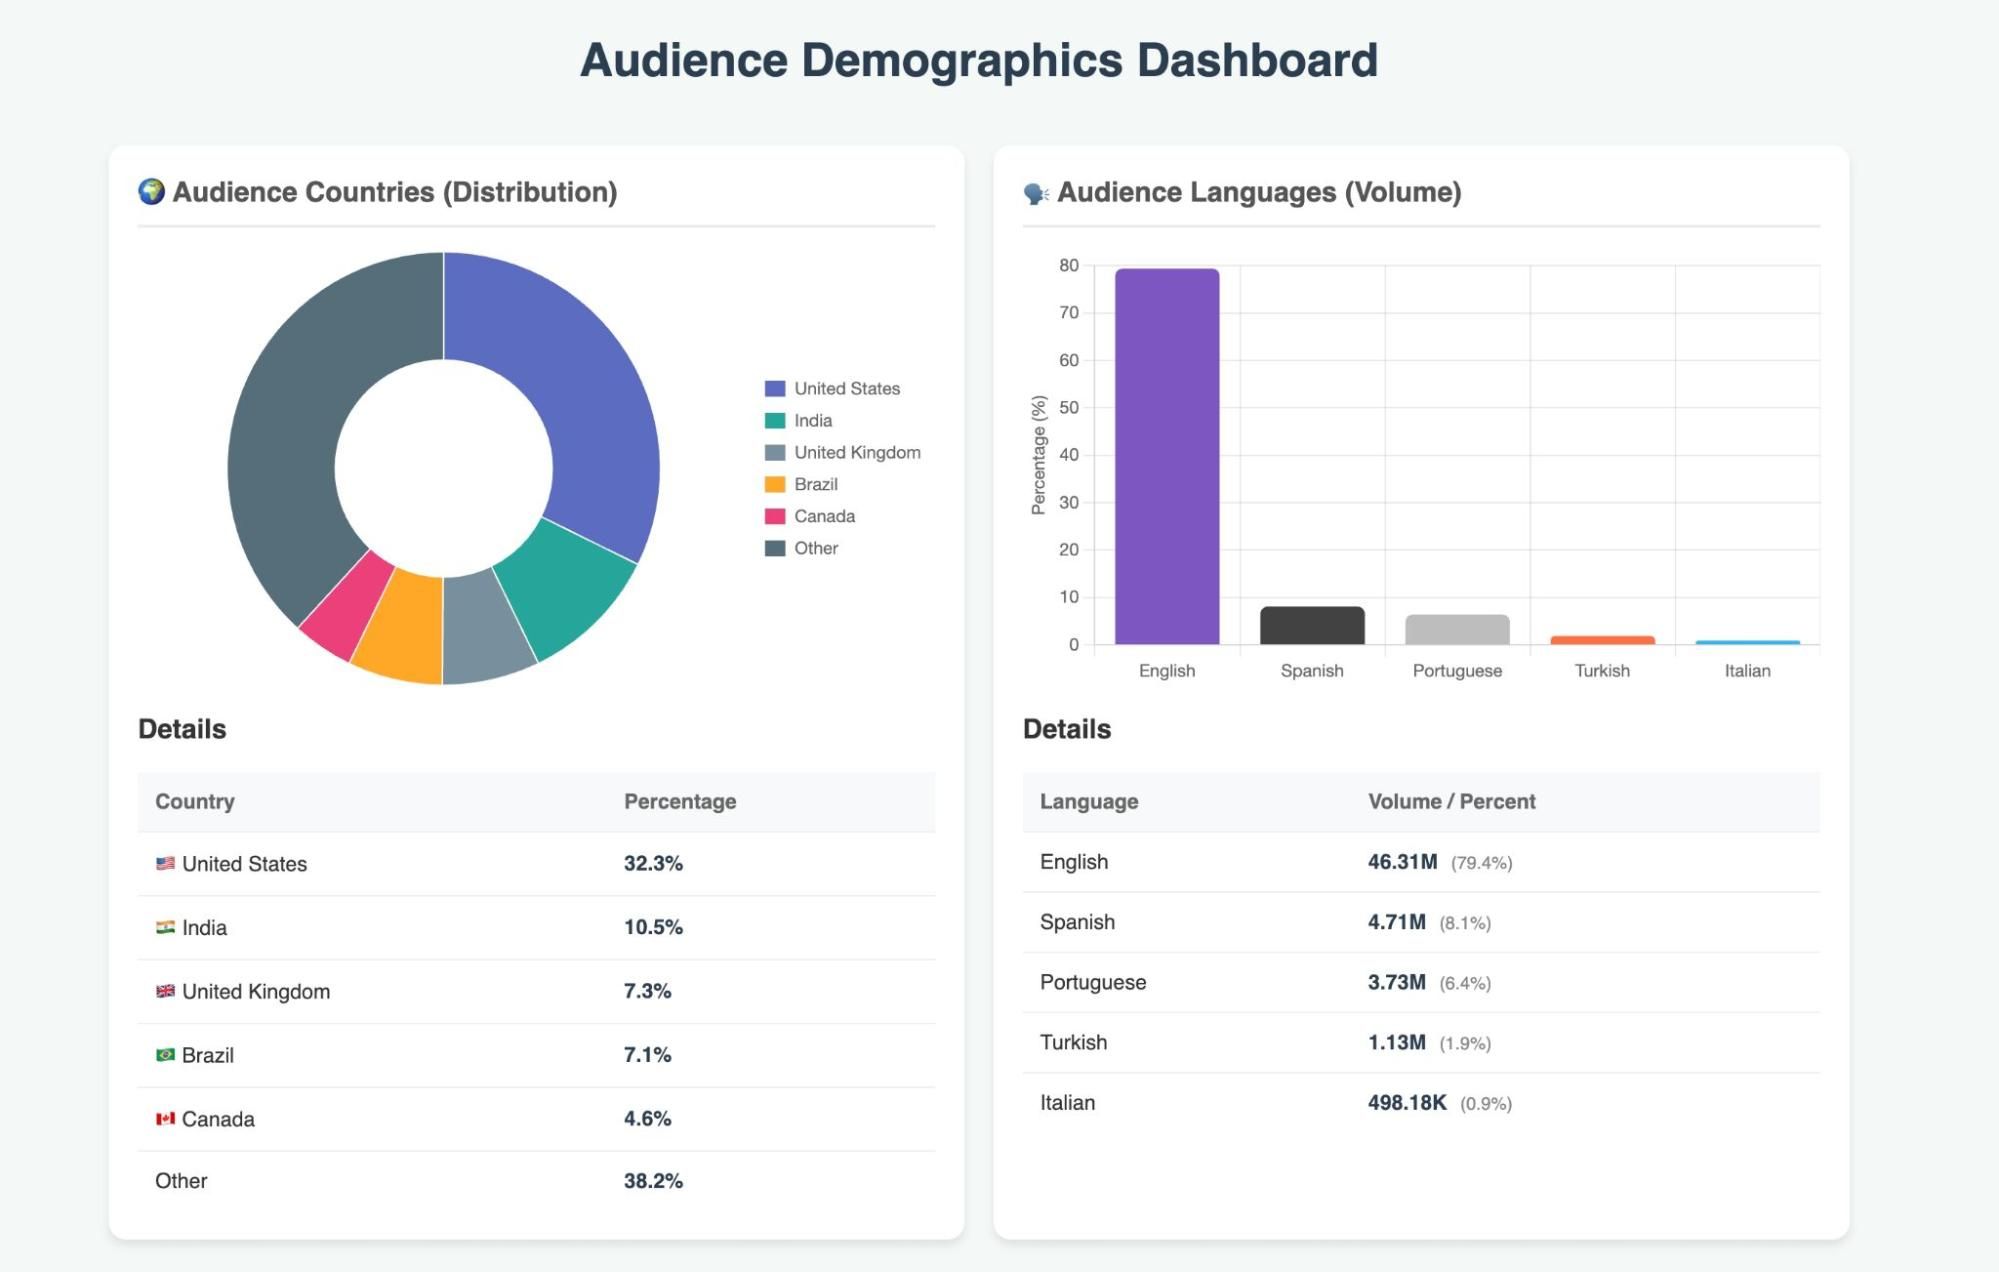
Content
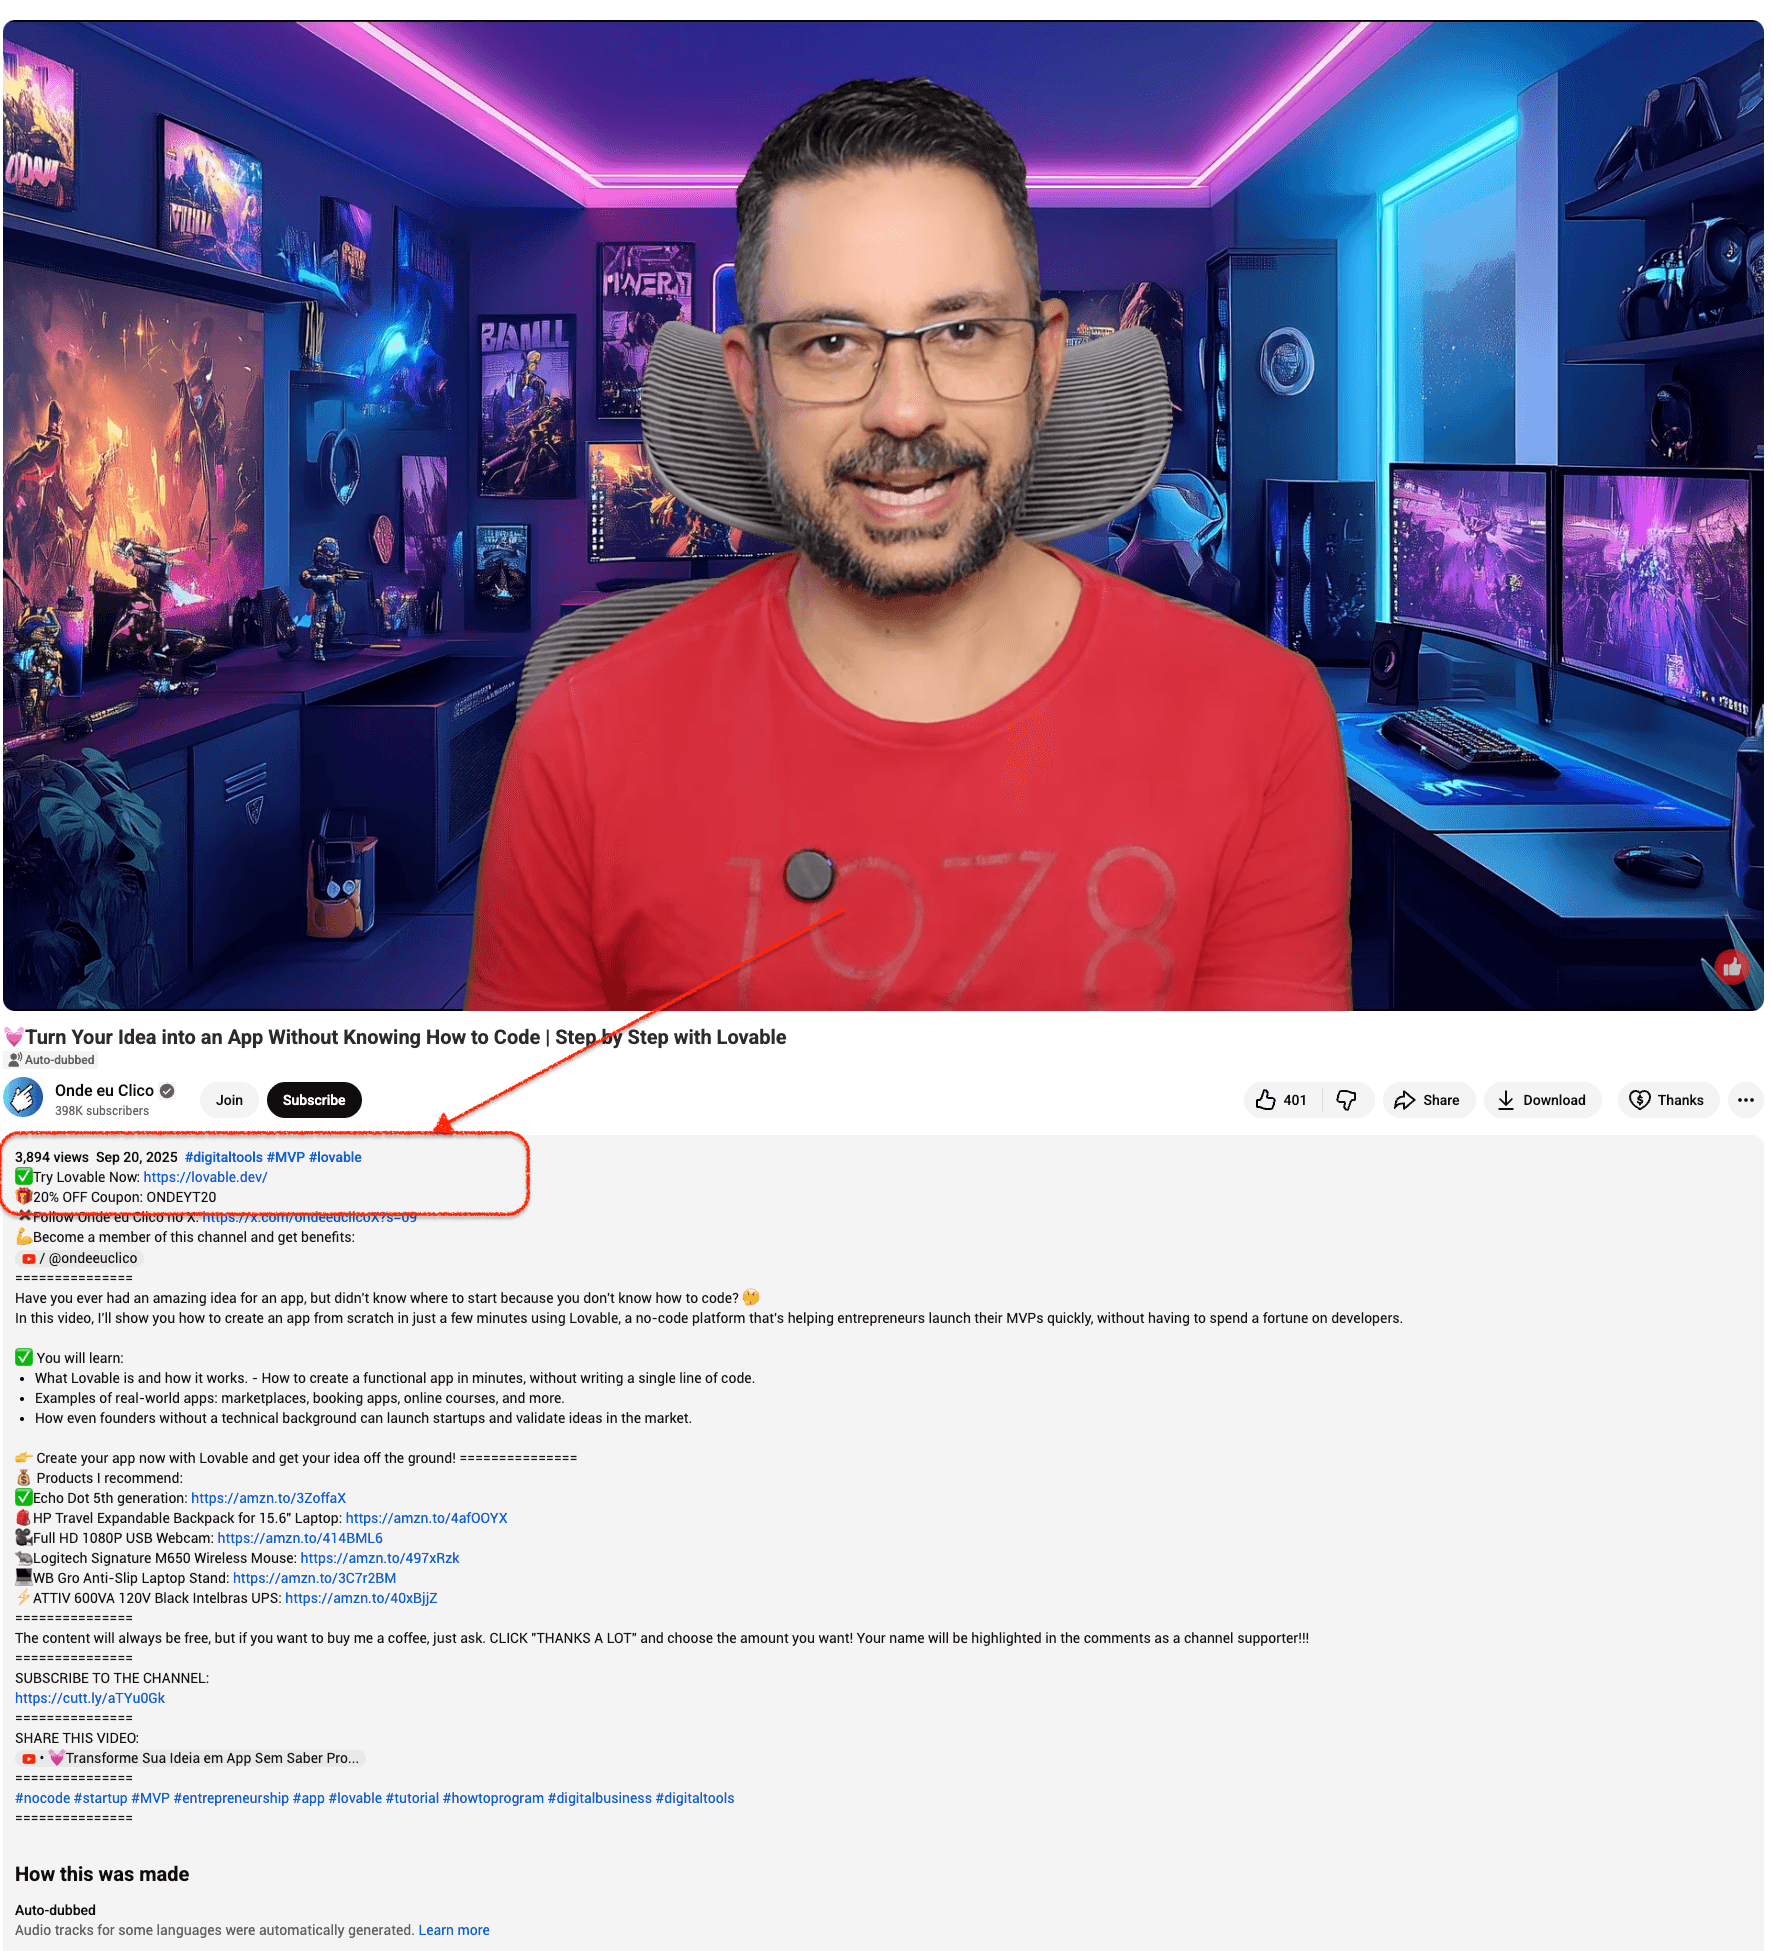
Amplift found that Lovable’s YouTube collaborations primarily consist of long-form dedicated videos, where creators focus on the product for the entire duration. This format significantly boosts trust, conversions, and long-term brand impact, though it is also the most costly type of collaboration.
Example: Turn your Idea into an App Without Knowing How to Code | Step by Step with Lovable
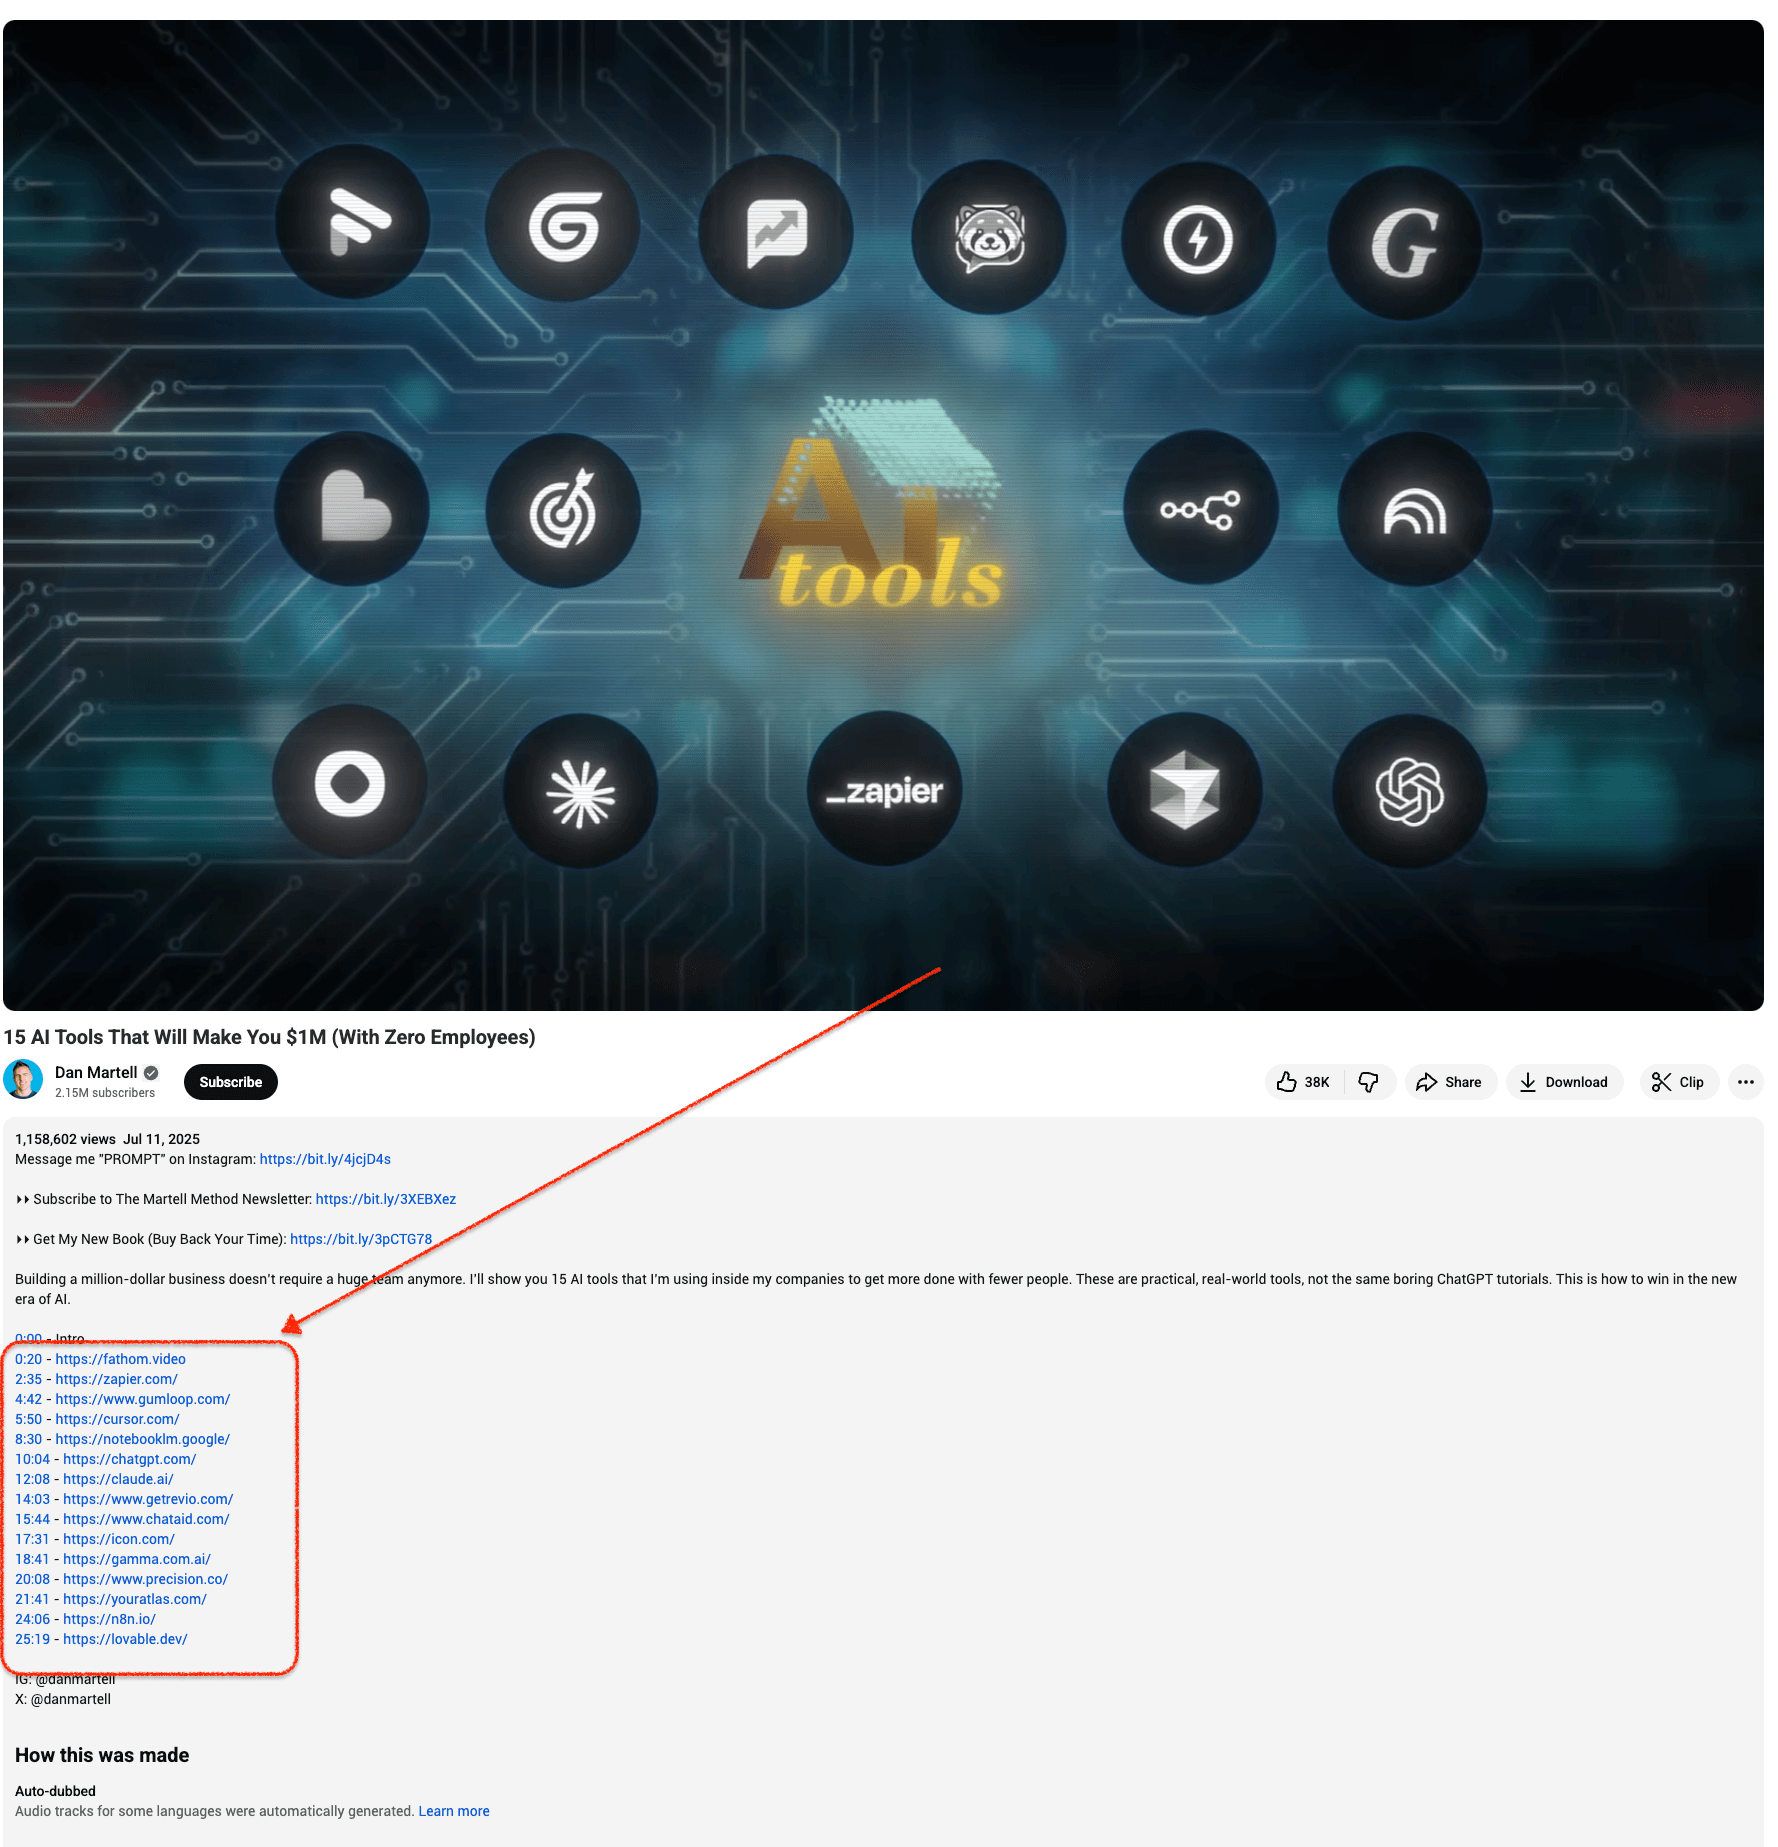
Lovable also utilizes listicle videos, which showcase similar but non-competing tools to emphasize their strengths. This approach is effective because it feels more educational than promotional, making it a cost-effective option for collaboration.
Example: 15 AI Tools That Will Make You $1M (With Zero Employees)
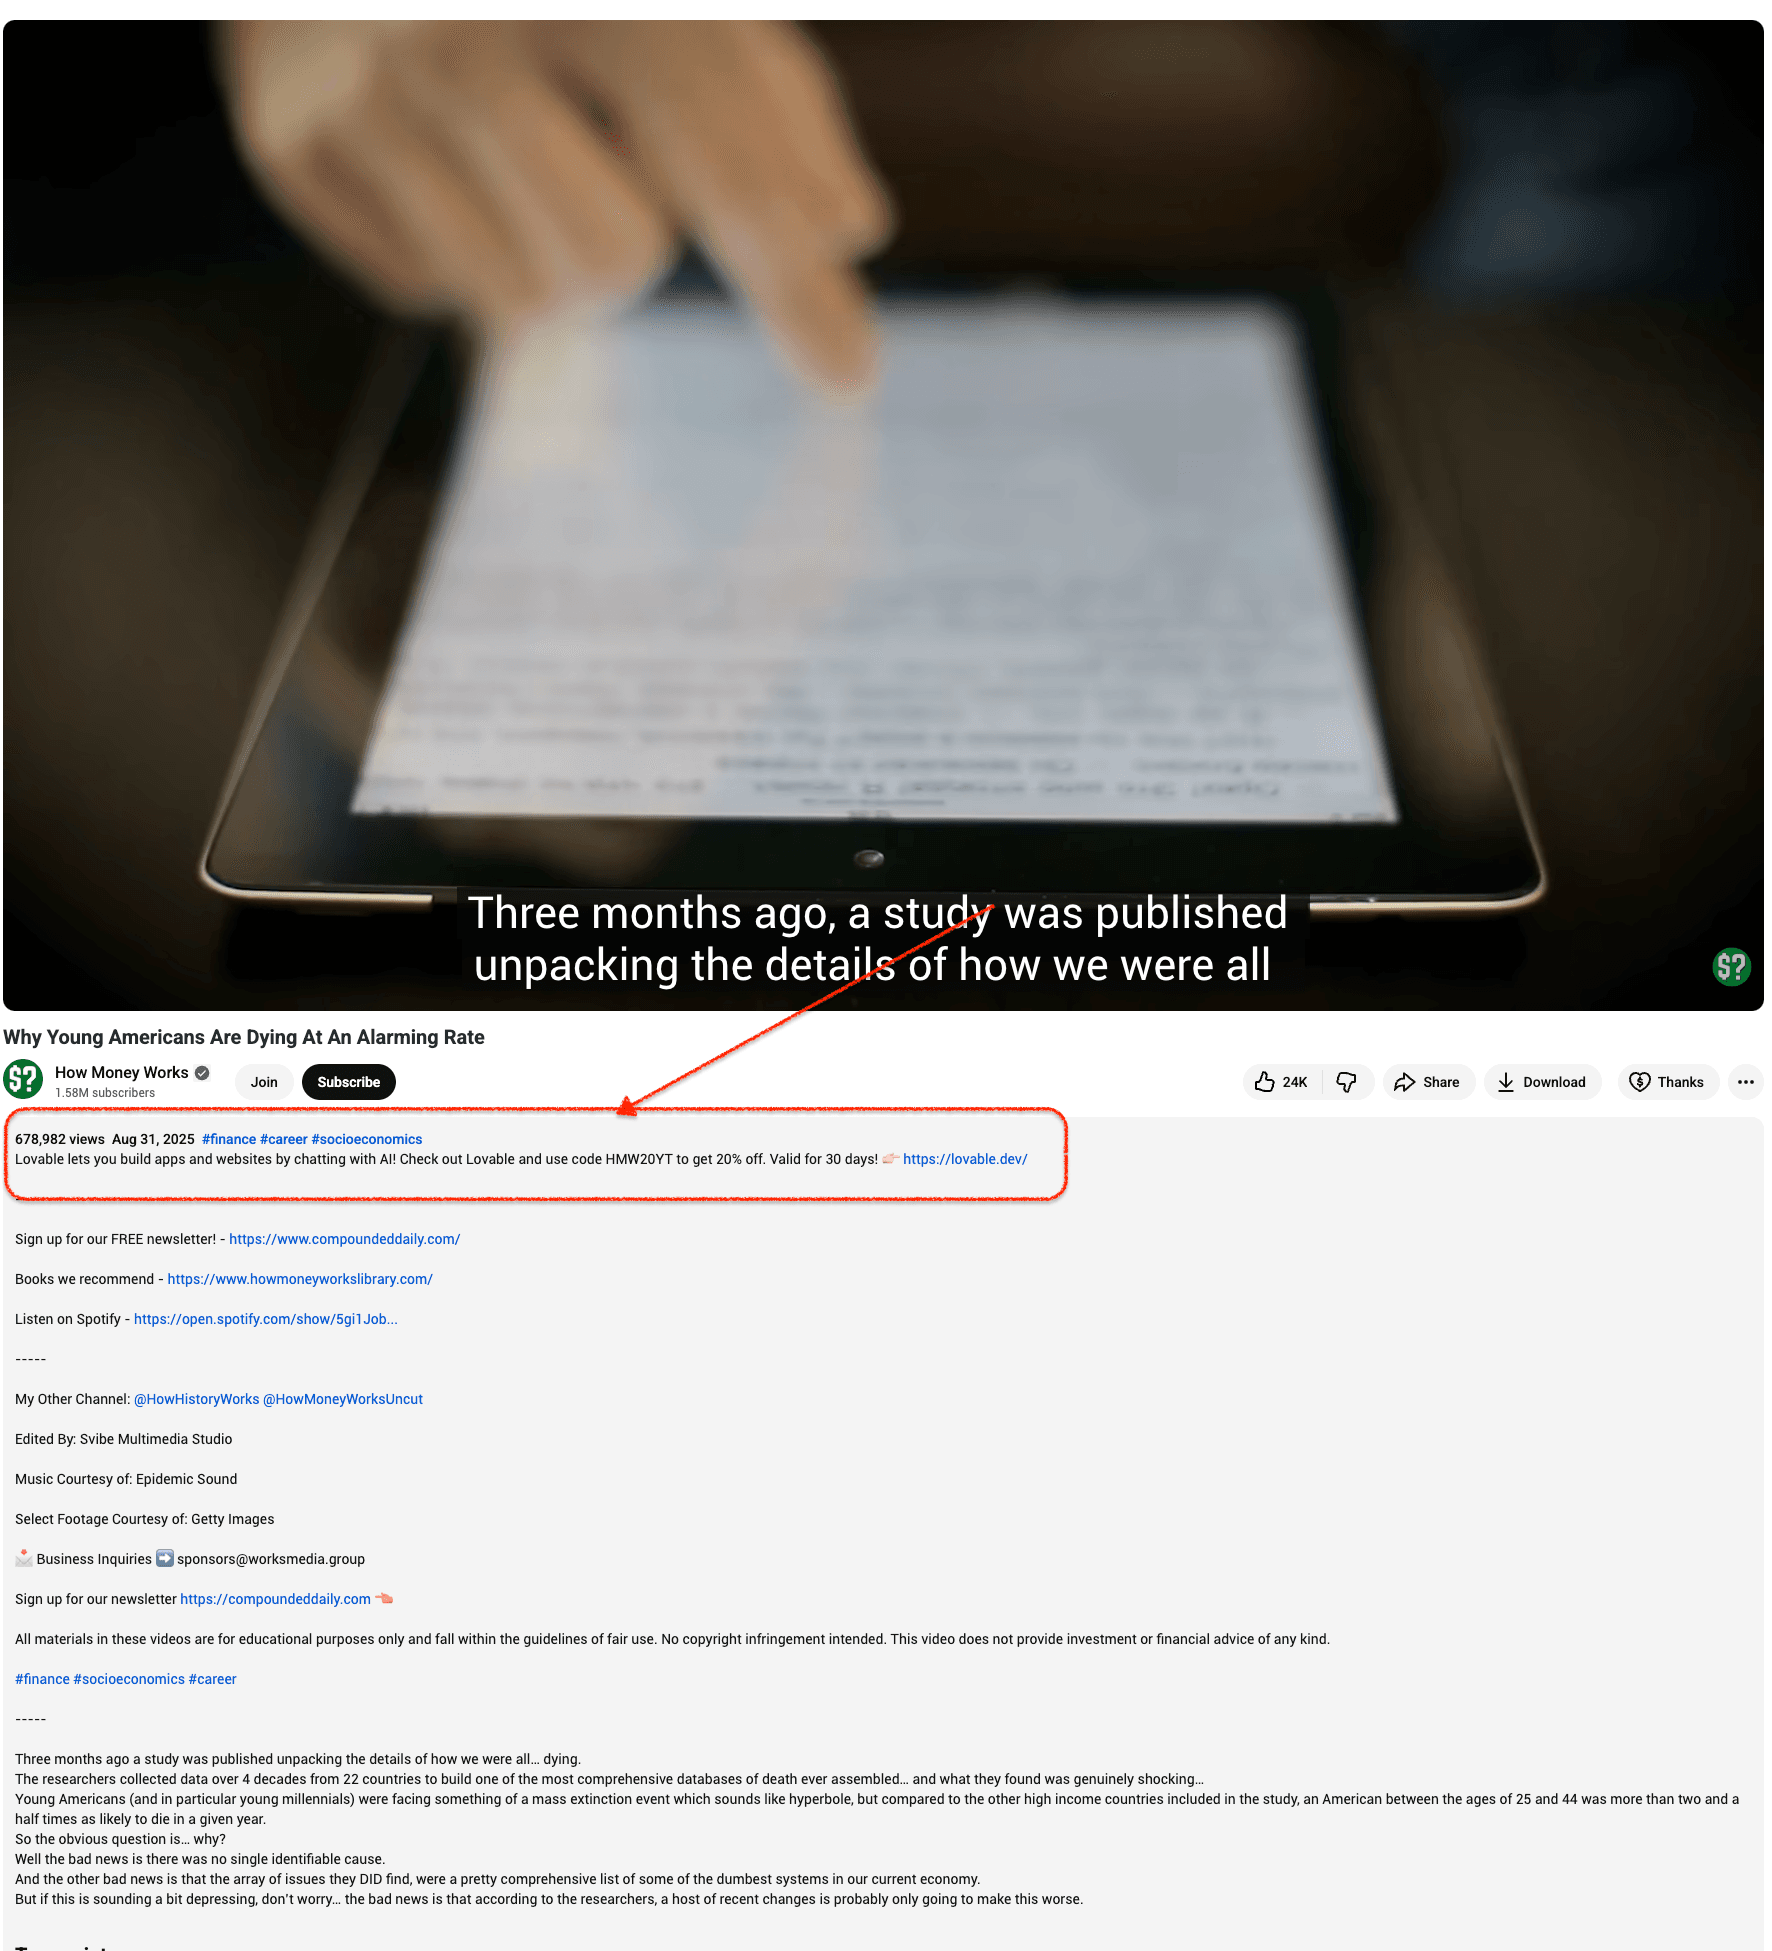
In contrast, "hard sponsorships," where a creator explicitly mentions, "today's sponsor is Lovable," are the least common format. Lovable prefers "smooth integrations," where the product seamlessly fits into the context of a study vlog, business case, or daily routine. These integrations are often scenario-driven, combining marketing with genuine storytelling.
Example: Why Young Americans Are Dying At An Alarming Rate
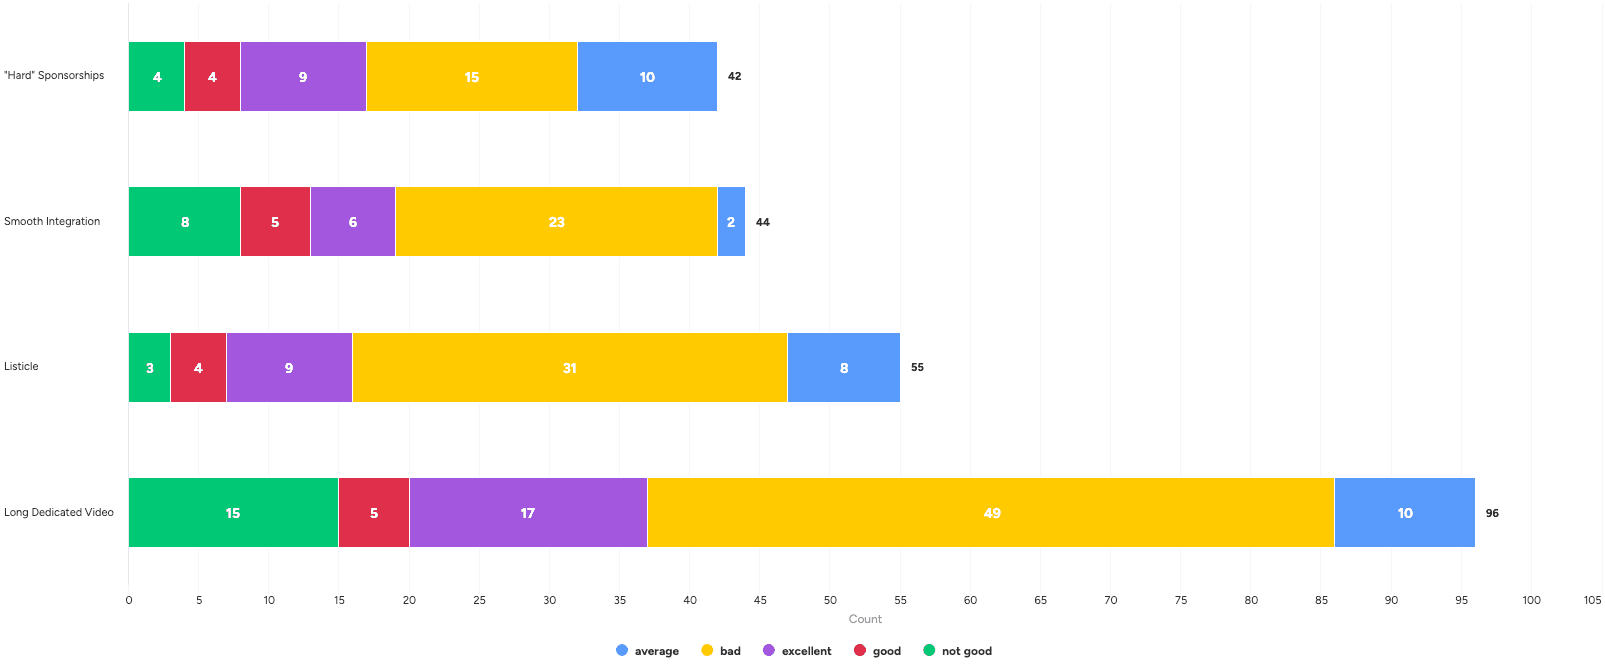
Performance by Format
Across all formats, long-form videos stand out with the highest proportion of “excellent” and “good” performances (23%). While other formats exhibit similar distributions, "hard sponsorships" tend to result in the highest proportion of average or "mediocre" content performance. This suggests that hard sponsorships could be a safe card in collaborations.
Performance by Video Length
We also examined how video length correlates with performance
Note:
Video performance is tiered using a relative performance ratio, calculated as:
Views Performance = (Video Views) ÷ (Channel’s Average Video Views)
The rating categories are defined as follows:
Bad: Views Performance < 0.2
Not Good: 0.2 ≤ Views Performance < 0.7
Average: 0.7 ≤ Views Performance < 1.3
Good: 1.3 ≤ Views Performance < 1.8
Excellent: Views Performance ≥ 1.8
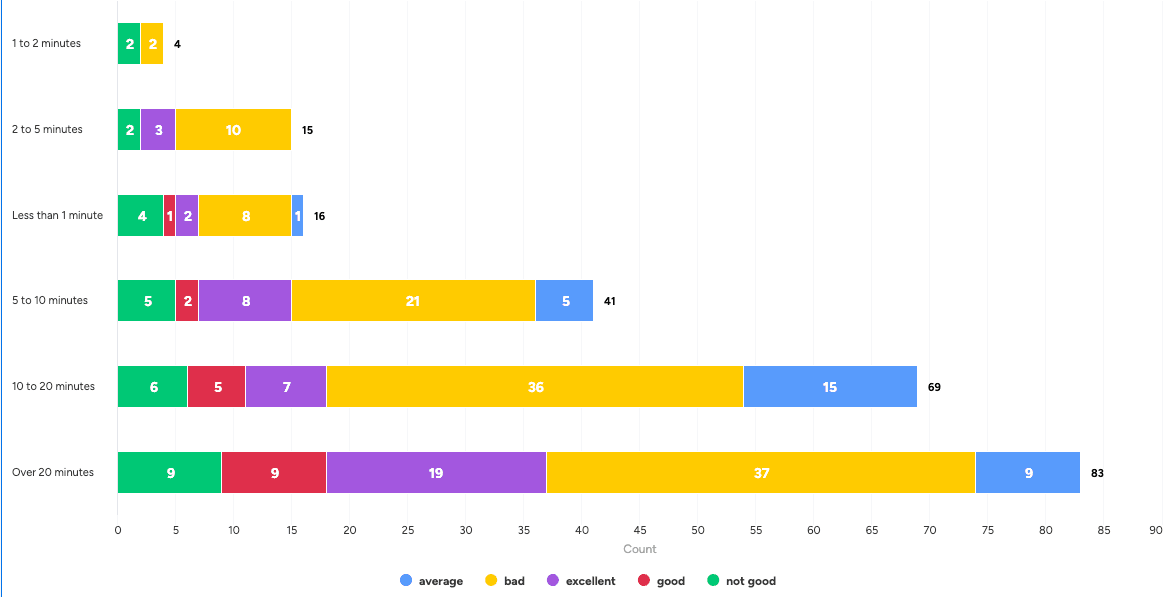
The most common video lengths in Lovable’s collaborations are:
Over 20 minutes (83 videos)
10–20 minutes (69 videos)
Videos longer than 20 minutes perform the best, with 34% rated as “good” or “excellent.” In comparison, videos lasting 5 to 10 minutes receive a “good” or “excellent” rating from 25% of viewers. This indicates that longer videos foster greater engagement and enhance brand performance, likely because they offer more depth and a continuous narrative.
Most of those youtube videos can be categorized into these types:
- Tutorials & How-to: Step-by-step guides for building apps, websites, or using AI tools.
Example: Master Lovable in 17 minutes (NEW 2.0 UPDATE) - Product Reviews & Comparisons: Evaluations and comparisons of tools or platforms.
Example: I Tried Lovable.dev So You Don't Have To (But Maybe You Should) - Case Studies & Success Stories: Personal experiences and business growth stories.
Example: How I'd Make a $10,000 App with Lovable In 1 hour (AI + No Code) - News & Updates: Industry news, tool releases, and weekly roundups.
Example: Lovable AI's New Update - Finally a Complete App Builder - Interviews & Podcasts: Expert conversations and influencer interviews.
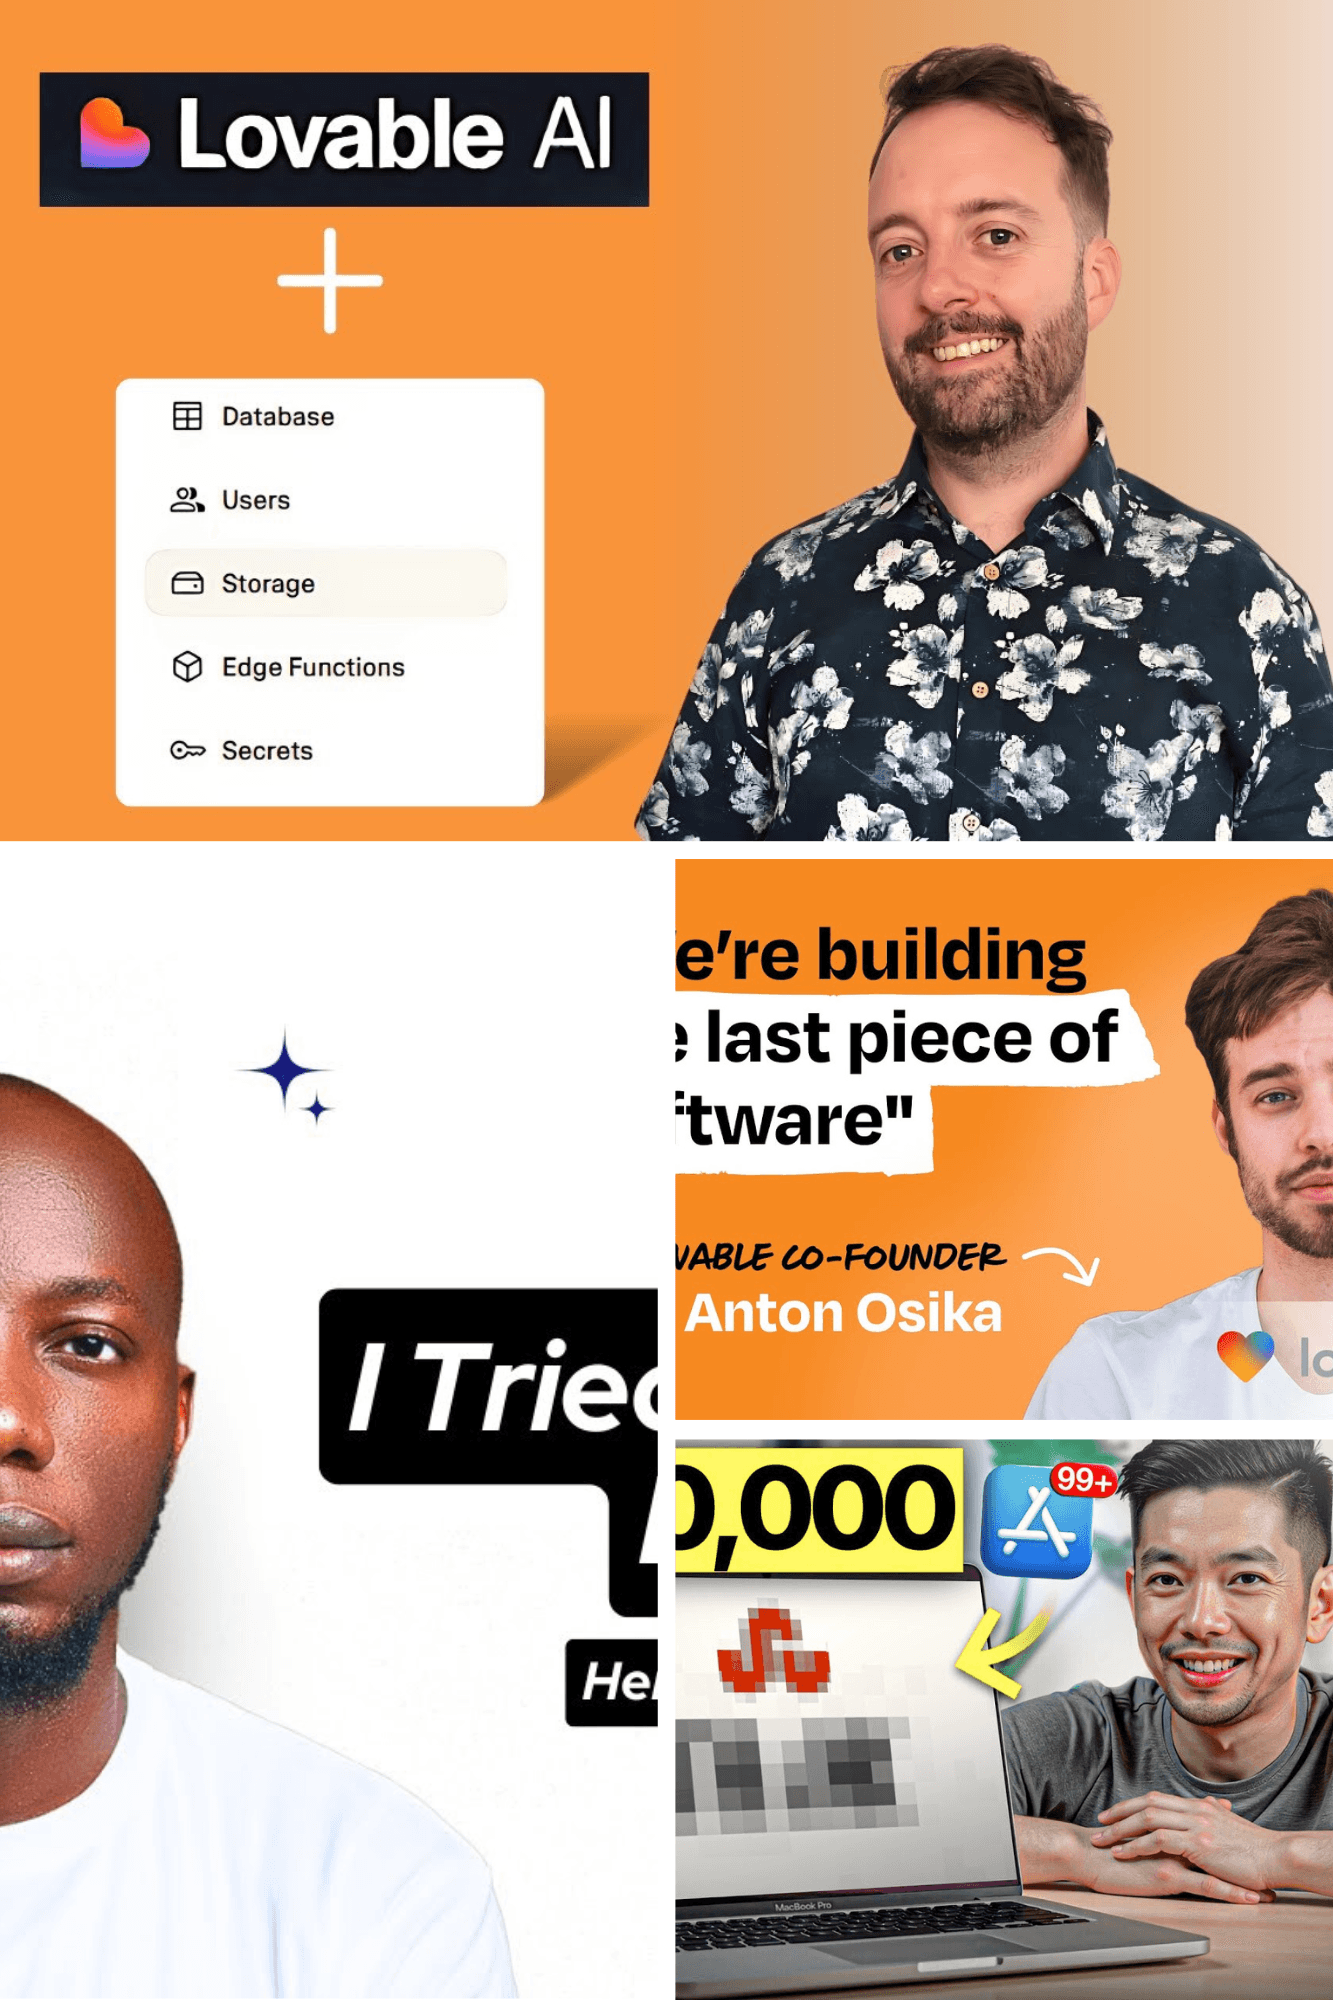
Example: Building Lovable: $10M ARR in 60 days with 15 people | Anton Osika (CEO and co-founder)
Lovable’s Twitter Strategy: Community, Conversation and Product Voice
Overview
Unlike visual-first platforms like YouTube or Instagram, Twitter (X) serves as Lovable’s real-time engine for awareness, community voice, and product storytelling.
We identified 249 influencers on Twitter who have promoted Lovable. The estimated cost per engagement (CPE) is approximately $0.13, which is quite competitive. According to Amplift’s budget calculation model, the cost for this channel ranges from $2,900 to $7,300.
Despite limited discoverability and rising data restrictions, Lovable’s strategy focuses on owned influence, grassroots advocacy, and feature-driven conversations rather than paid promotions.
The brand’s official account (116.5K followers) leads the conversation, posting 3–8 times per day with consistent engagement and high content visibility. Surrounding it is an organic network of 249 creators — mostly micro or small accounts — that amplify product discussions, share updates, and create authentic user narratives.
Overall, Lovable uses Twitter not as a sponsorship platform, but as a live ecosystem for brand trust, technical credibility, and community-led marketing.
Key Takeaways & Actionable Techniques
| Key Tactic | Strategic Role / Data-Backed Result | Actionable Insight you can apply |
|---|---|---|
| Activate the Grassroots Network | 86.7% of influencer mentions come from “Below Nano” creators (fewer than 1,000 followers), indicating powerful organic user advocacy. | Design community initiatives that excite your smallest user base to share organically, creating authentic buzz that paid efforts cannot replicate. |
| Anchor to Innovation | Product Feature Update posts consistently achieve the highest engagement rates. | Use Twitter as the primary channel for technical storytelling and real-time feature announcements; innovation narratives convert directly into visibility. |
| Prioritize Micro-Influencers | Micro influencers deliver the highest average tweet engagement rate (1,888 engagements). | Strategically partner with Micro-influencers for niche authority and genuine advocacy over pure reach from larger tiers. |
| Leverage Owned Influence | The brand uses founders and employees as a distribution engine, with the official account posting 3–8 times per day. | Implement an "amplification loop" where the team's personal and official accounts reinforce each other to maximize reach and build community trust. |
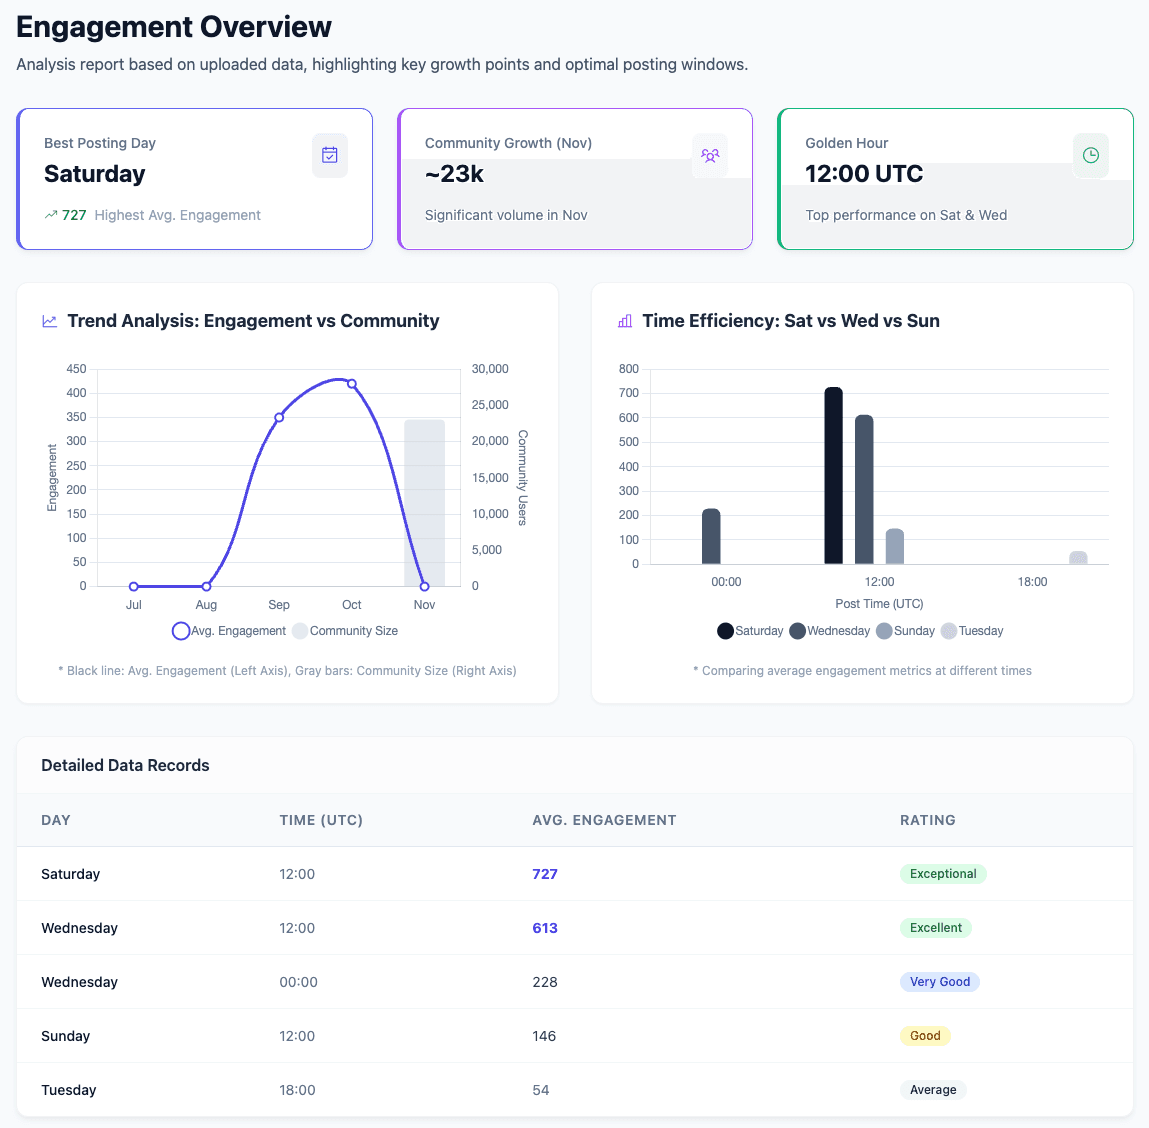
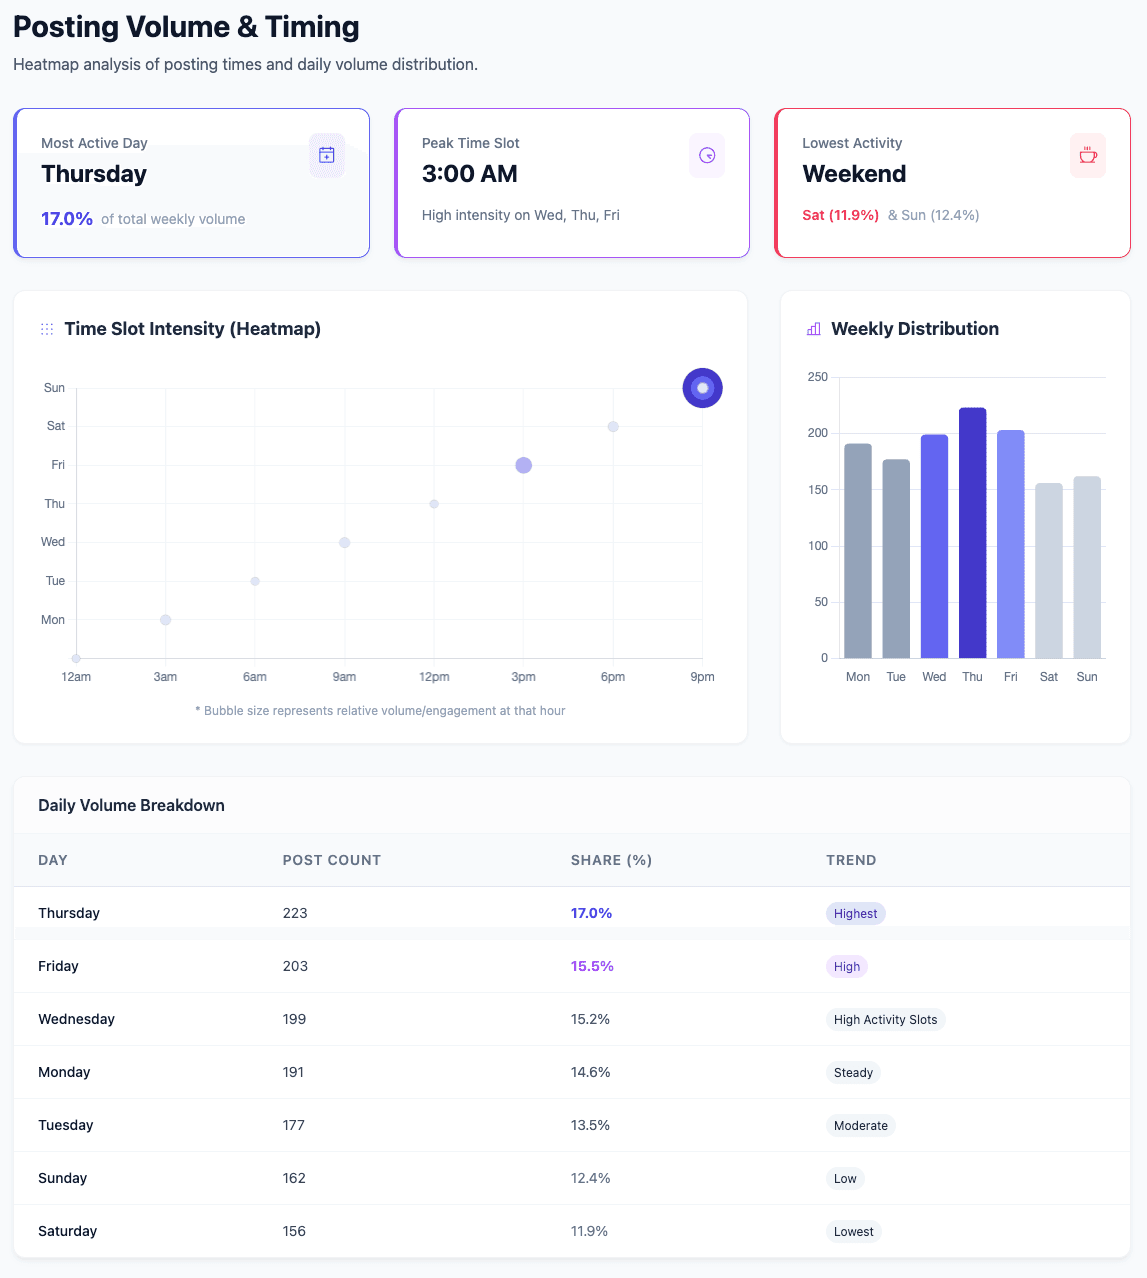
| Optimize Posting Time | Tuesday at 3:00 PM UTC is the time of highest average engagement for the official Lovable X account. | Tailor the content publishing schedule to align with the proven peak time to maximize the visibility and performance of core announcements. |
*
Owned Influence
Lovable’s twitter account operator (or an operation team) and their members must be scrolling content all-day-long.
Below is Amplift’s detailed influencer profile analysis of Lovable’s Twitter account.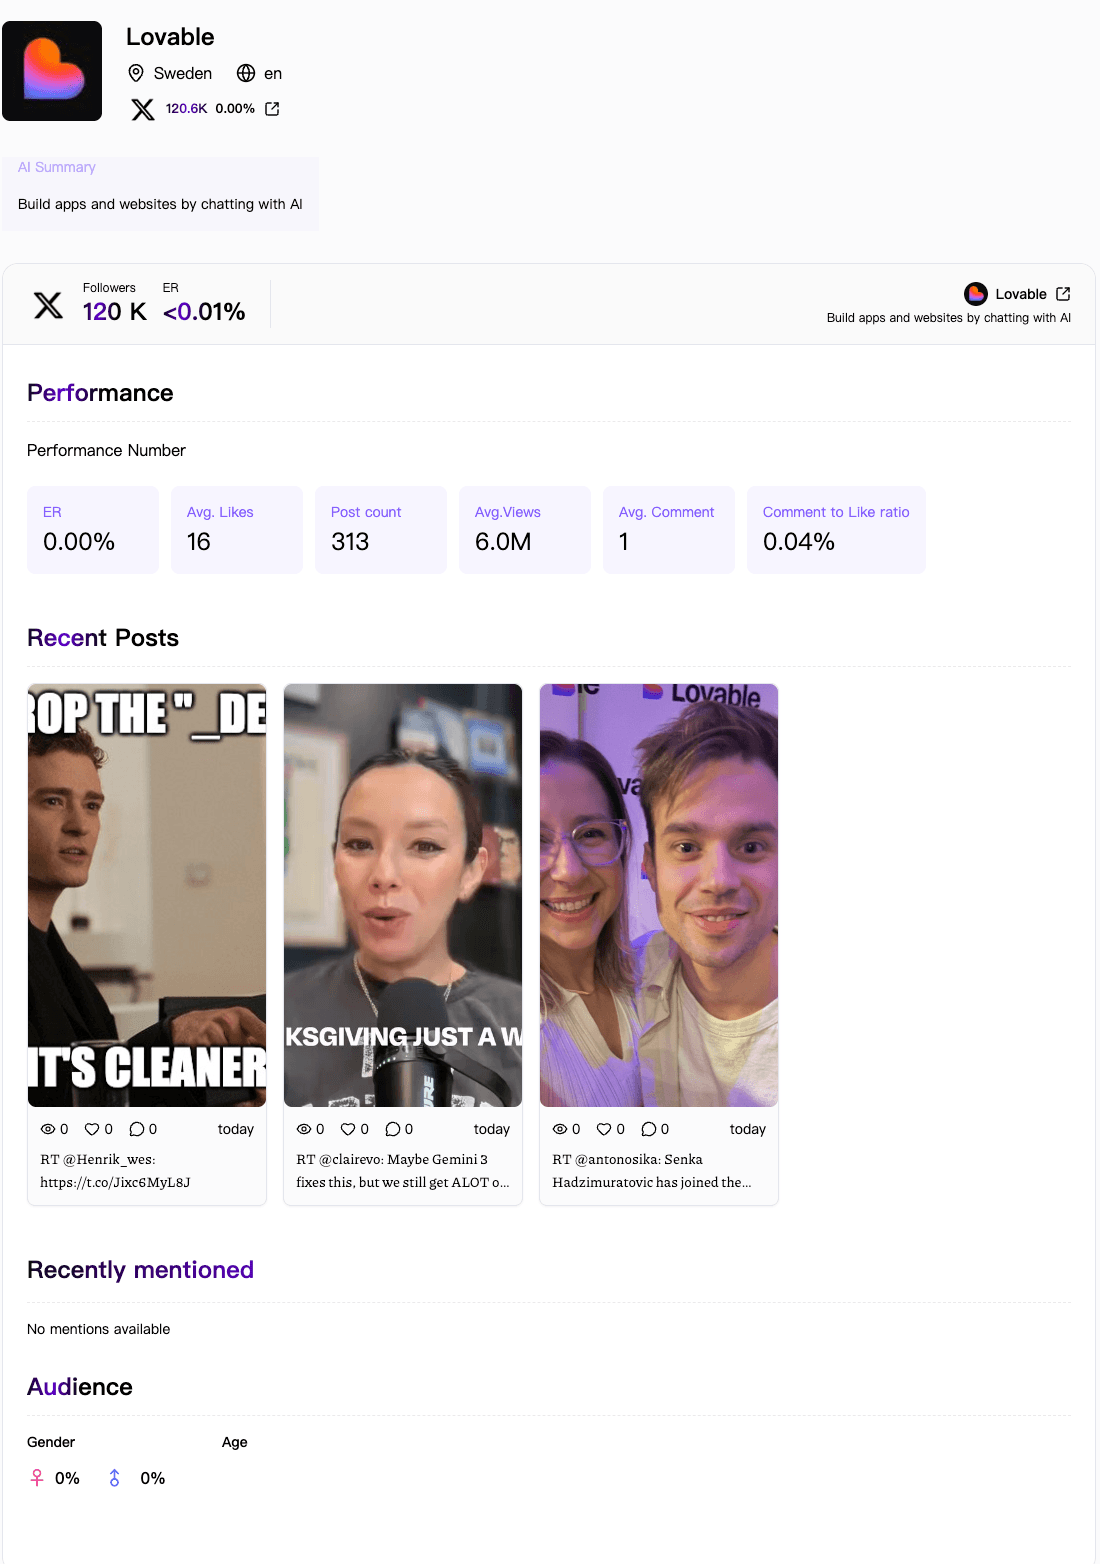
Lovable’s X account has been posting at roughly five times per day on average since launching in April 2024 — pretty frequent for a brand page. That said, it’s not unheard of (just think about how often Donald Trump or Elon Musk post). What is wild is the performance: even after excluding quotes and reposts, each tweet averages around 6 million views.
Like other brands that have really nailed Twitter, Lovable’s presence isn’t limited to the official account. They’ve turned the whole team into a distribution engine, with founders and employees actively posting, and the brand account and personal accounts constantly retweeting each other. Even if their audiences overlap, this “loop” massively amplifies reach and keeps Lovable in people’s feeds. In a space where Twitter users are very quick to sniff out anything that feels like a forced sponsorship, this kind of founder- and employee-led amplification is one of the most organic, low-risk, and effective ways to grow a community.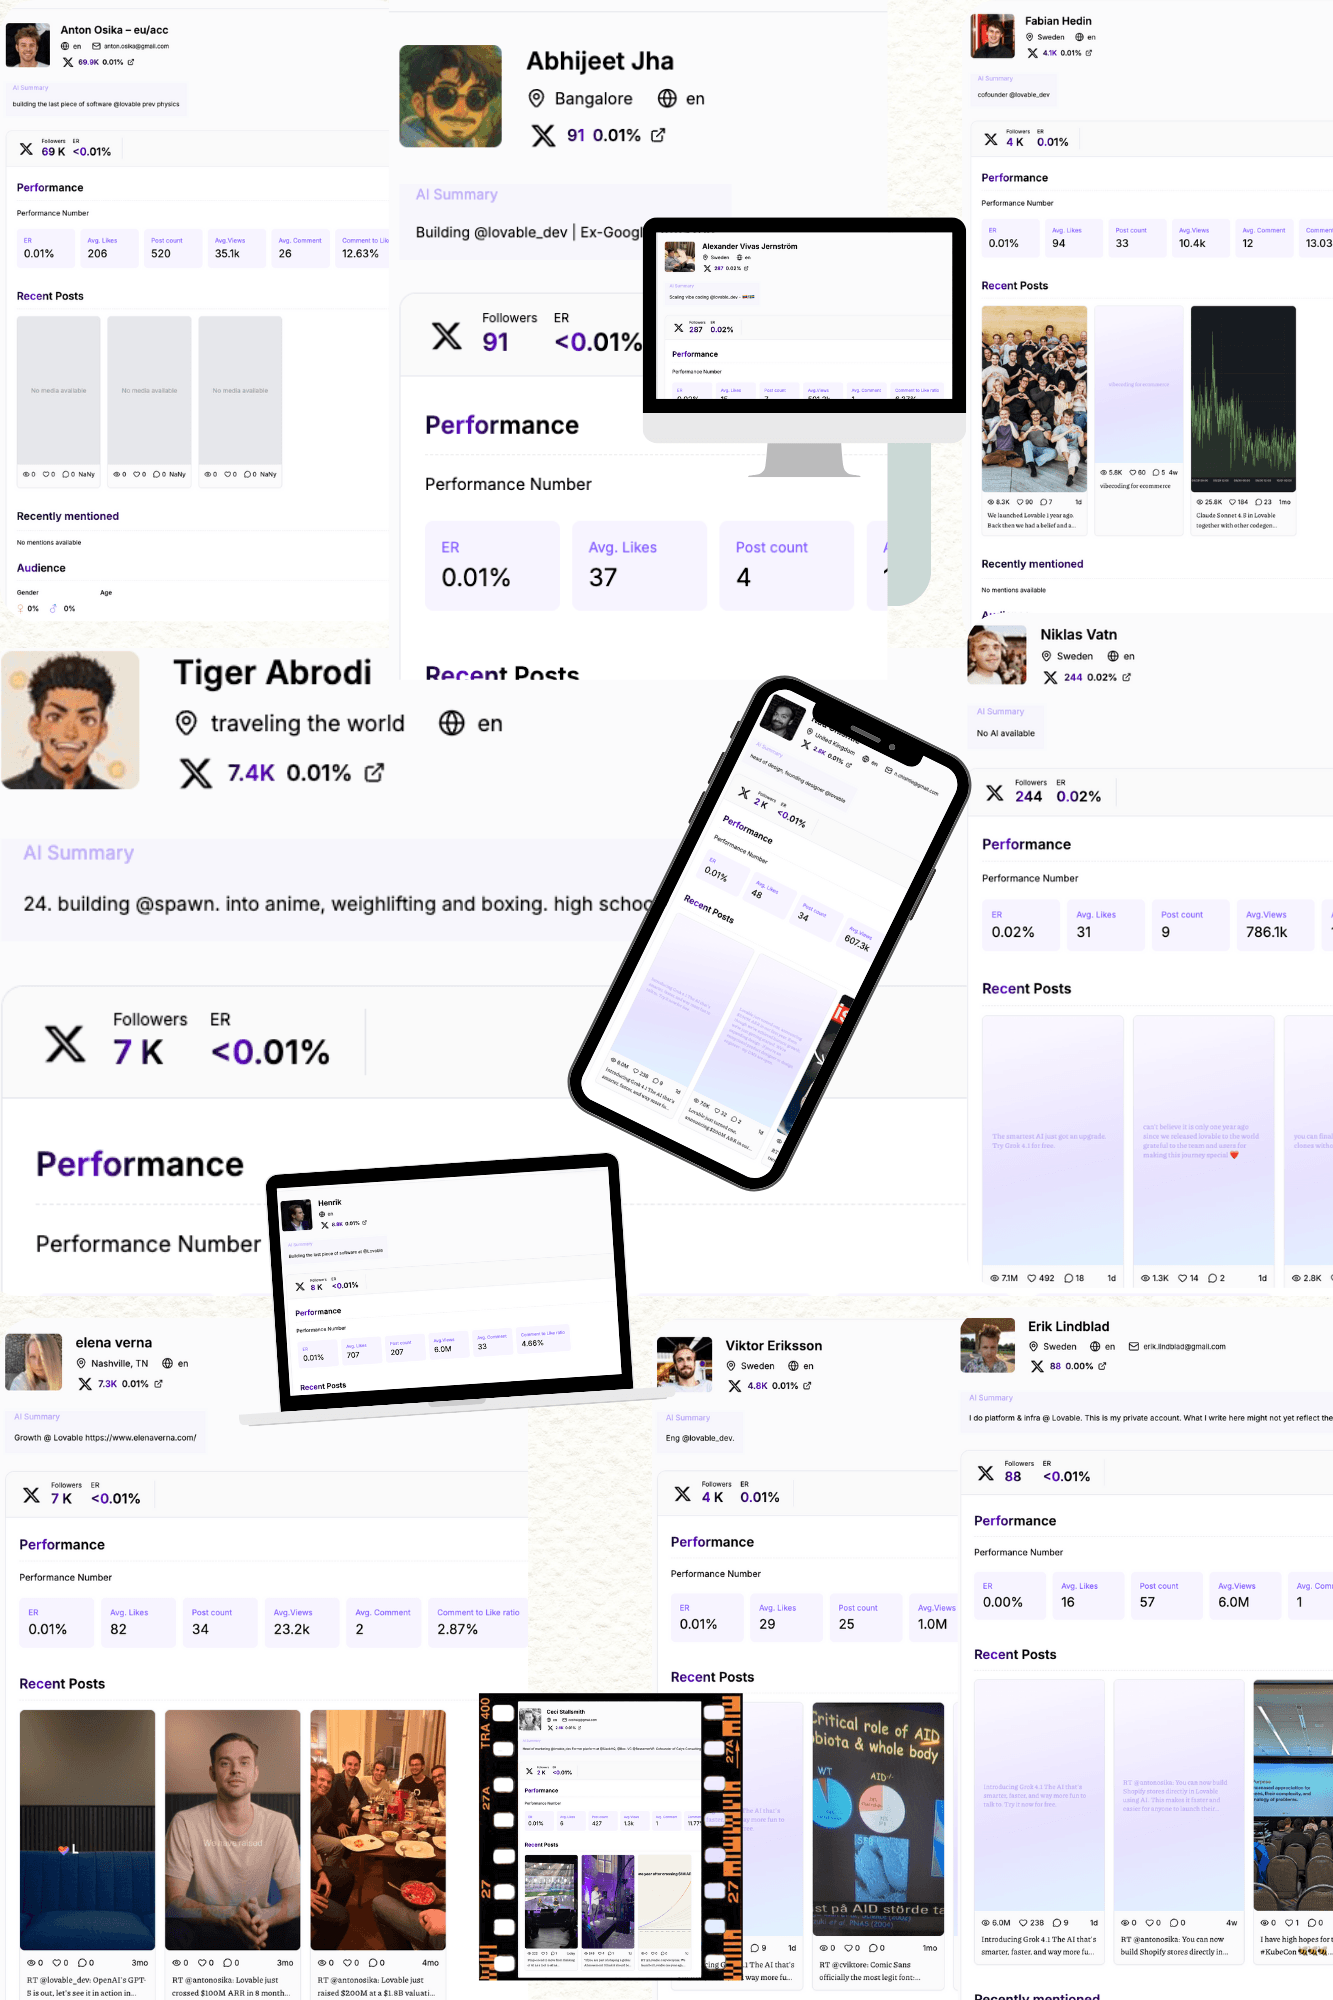
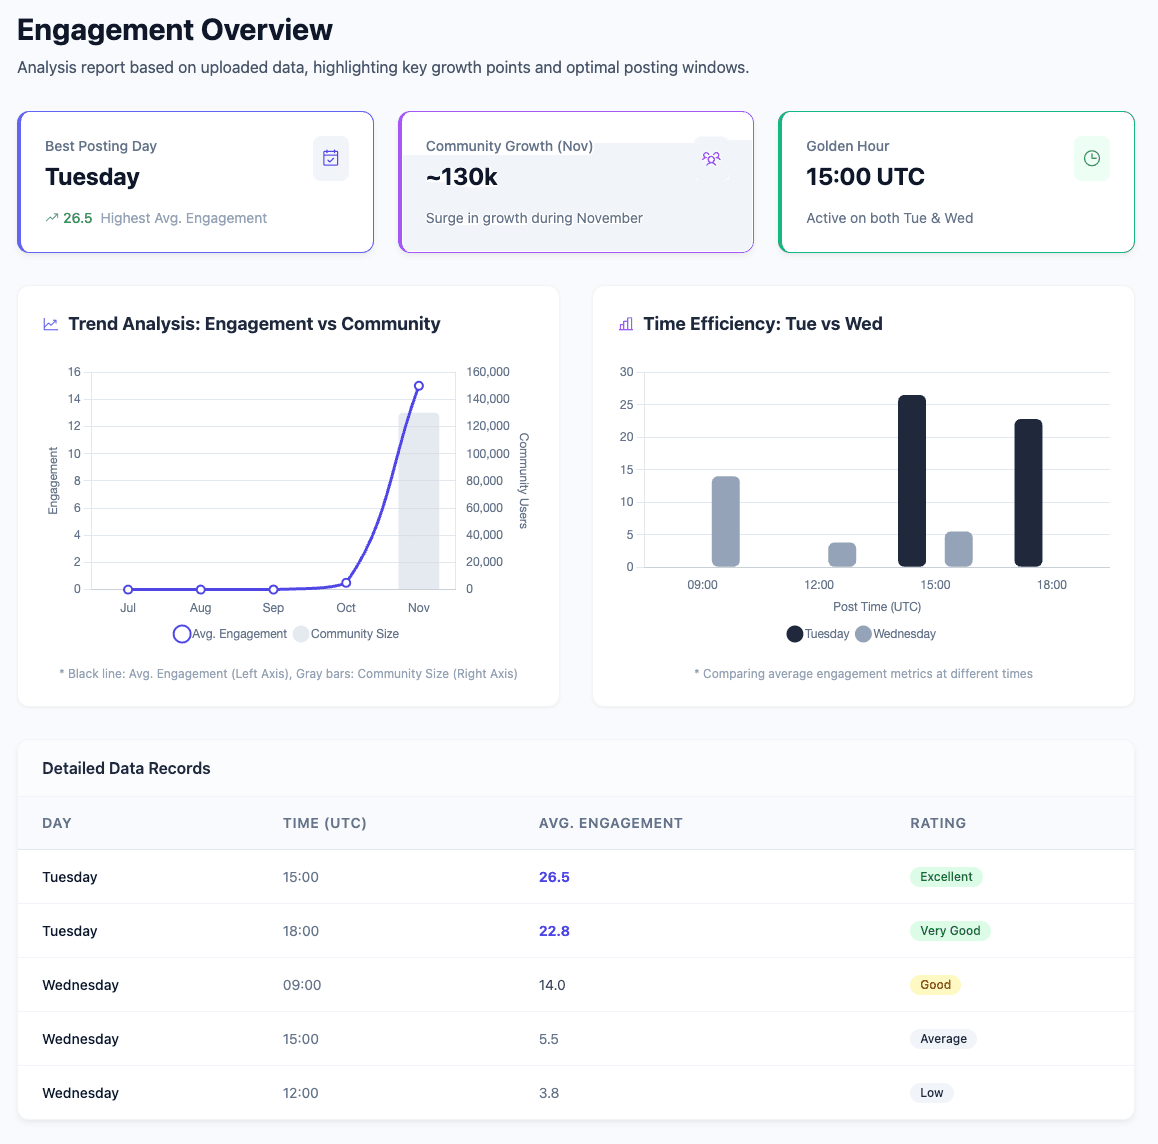
We analyzed the optimal times for posting on Lovable’s Twitter account. Our findings show that Tuesday, particularly around 3:00 PM UTC, is when Lovable experiences the highest engagement on Twitter.
Influencer Presence
By leveraging Amplift’s intelligent Twitter influencer discovery system, we identified 249 influencers who actively share positive content or promotional mentions about Lovable. As mentioned above, the total estimated cost may range from $2.9k-7.3k.
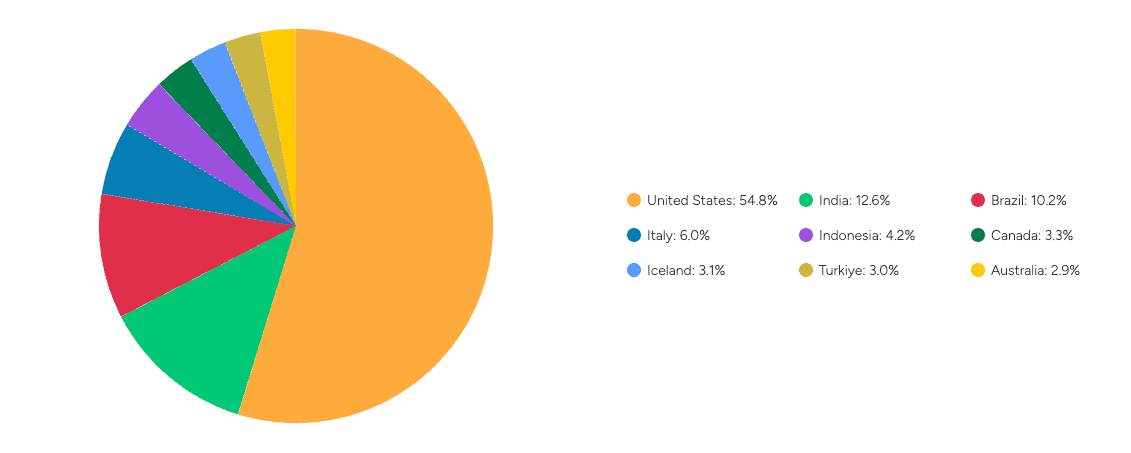
Analyzing influencer tiers, we discovered that the "Below Nano" category, which includes creators with fewer than 1,000 followers, accounts for a significant 86.7%. These creators often share organic or user-generated content instead of engaging in formal partnerships. This trend highlights Twitter's community-driven essence, where influence grows through grassroots discussions rather than conventional paid advertising.
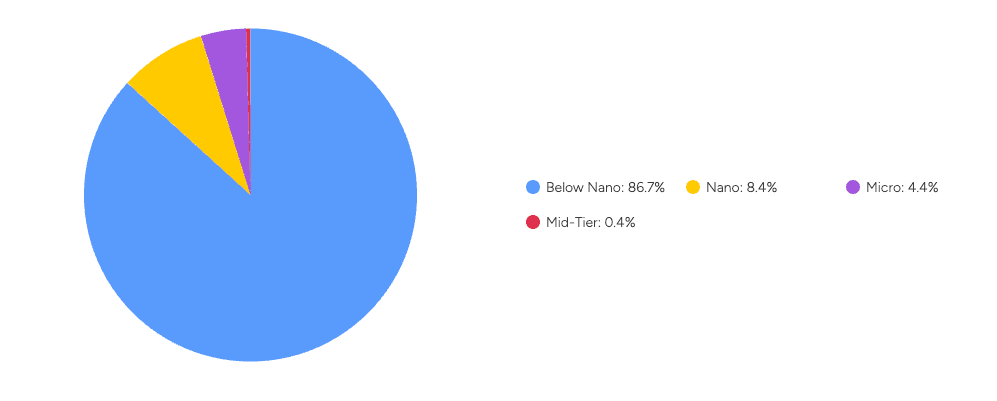
Pie chart of X (Twitter) influencer tiers: Below Nano dominates at 86.7%, Nano is 8.4%, Micro is 4.4%, and Mid-Tier is 0.4%. The chart shows that Lovable mentions come mostly from very small, grassroots accounts.
In our analysis of average tweet engagement rates, Micro influencers lead the way with the highest performance, surpassing all other groups. They are closely followed by Nano and Mid-tier influencers. In contrast, Below Nano influencers, despite their large numbers, tend to generate lower engagement because of their smaller audience size.
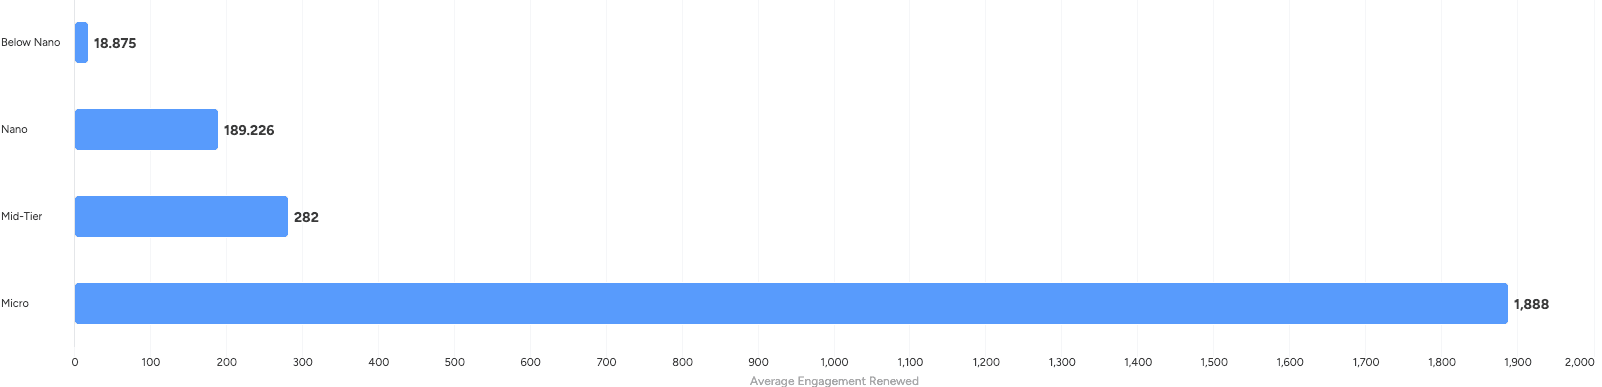
Micro-influencers are ideal for Twitter collaborations, offering optimal reach, authenticity, and engagement.
Lovable's Twitter strategy prioritizes authentic, conversation-focused engagement over conventional influencer networks. Performance is driven by smaller creators and micro-influencers whose credibility and active participation transform genuine user enthusiasm into lasting organic visibility, rather than relying on paid promotions.
Audience
Over the past four months (from May to September), conversation around Lovable on X has surged dramatically. Mentions of the brand have exceeded 40,000, averaging nearly 10,000 per month, making Twitter the most active platform for discussions about Lovable.
Sentiment analysis reveals that 45.7% of these mentions carry a positive tone, while 9.3% are negative and the remainder neutral. This distribution suggests that the discussions are largely organic, reflecting authentic community engagement rather than coordinated marketing efforts. The overall sentiment skew toward positivity also indicates strong product-market reception and growing brand advocacy.
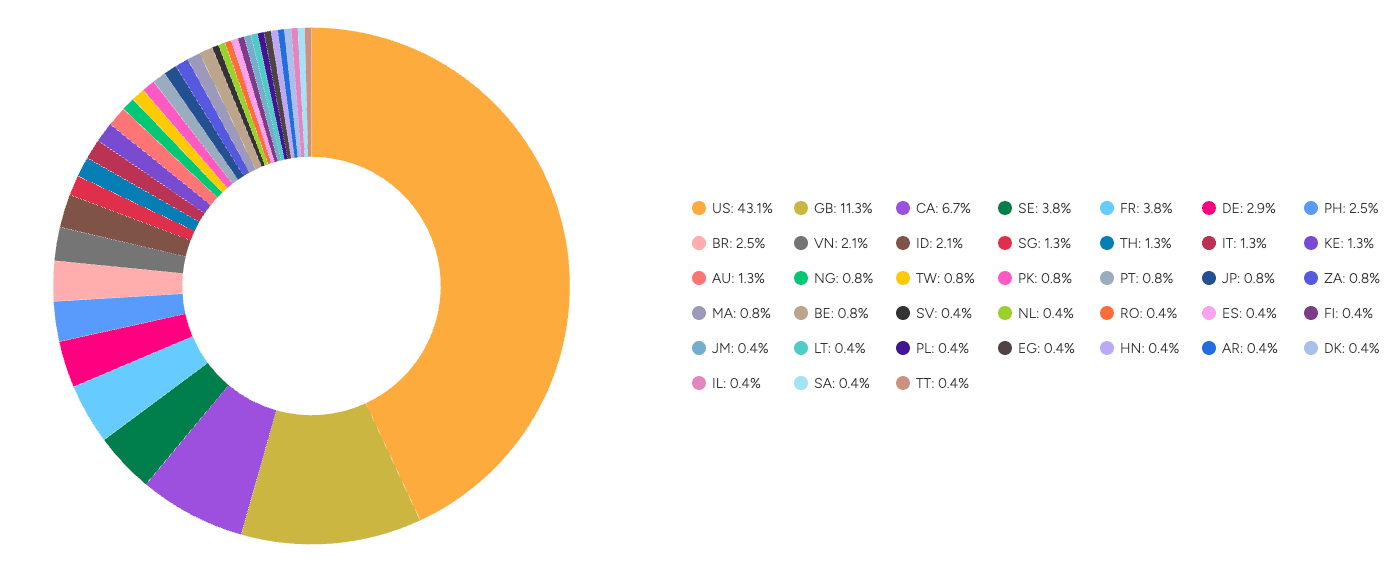
Geographically, the majority of mentions originate from the United States (54.8%), followed by India and Brazil. This distribution highlights Lovable’s dominant influence in Western tech and AI communities, with emerging traction in fast-growing markets across Asia and Latin America — a promising sign for the brand’s global resonance.
Content
As discussed earlier, conversations around Lovable on X (formerly Twitter) have evolved beyond paid promotions into a more organic ecosystem of advocacy. You’ll now see CEOs, entrepreneurs, and independent creators actively sharing their experiences with the product — a trend largely fueled by the founders’ high visibility on Twitter and the success of Lovable’s referral-driven community initiatives.
To better distinguish which posts might be sponsored versus authentically shared, we used Amplift's context-aware influencer analysis model to assess posting patterns, content tone, and timing. Based on this analysis, influencers’ content generally falls into three main categories:
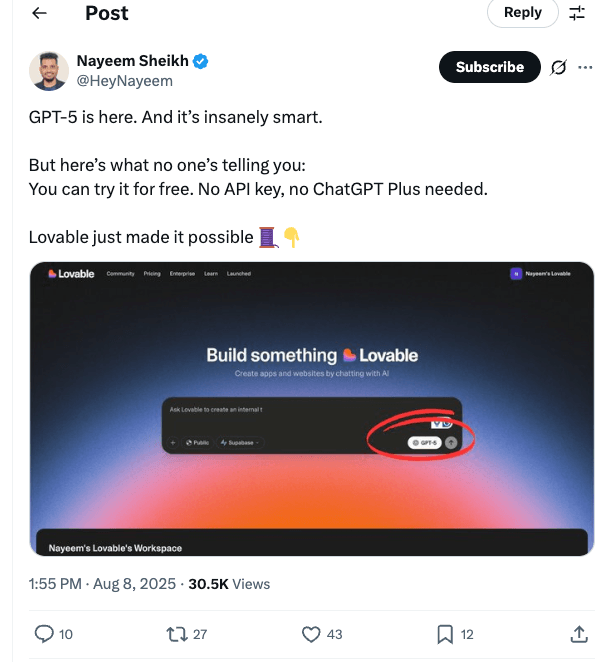
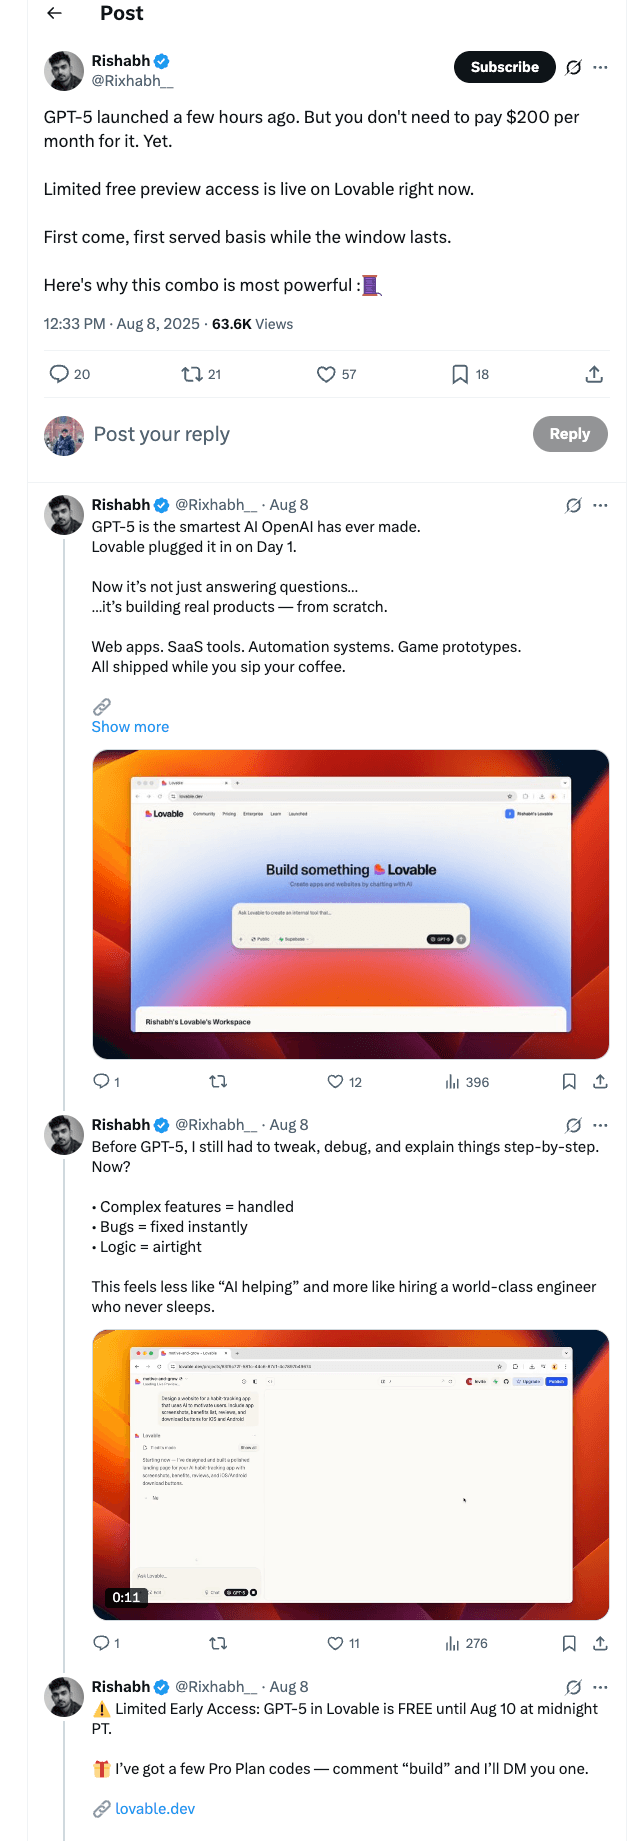
1. Product Feature Updates
These posts typically highlight Lovable’s newest capabilities. For example, when GPT-5 launched with certain features behind paywalls, numerous influencers showcased how Lovable supported GPT-5 integration without limitations — a move that quickly attracted significant traction.
Example: Rishabh’s post.
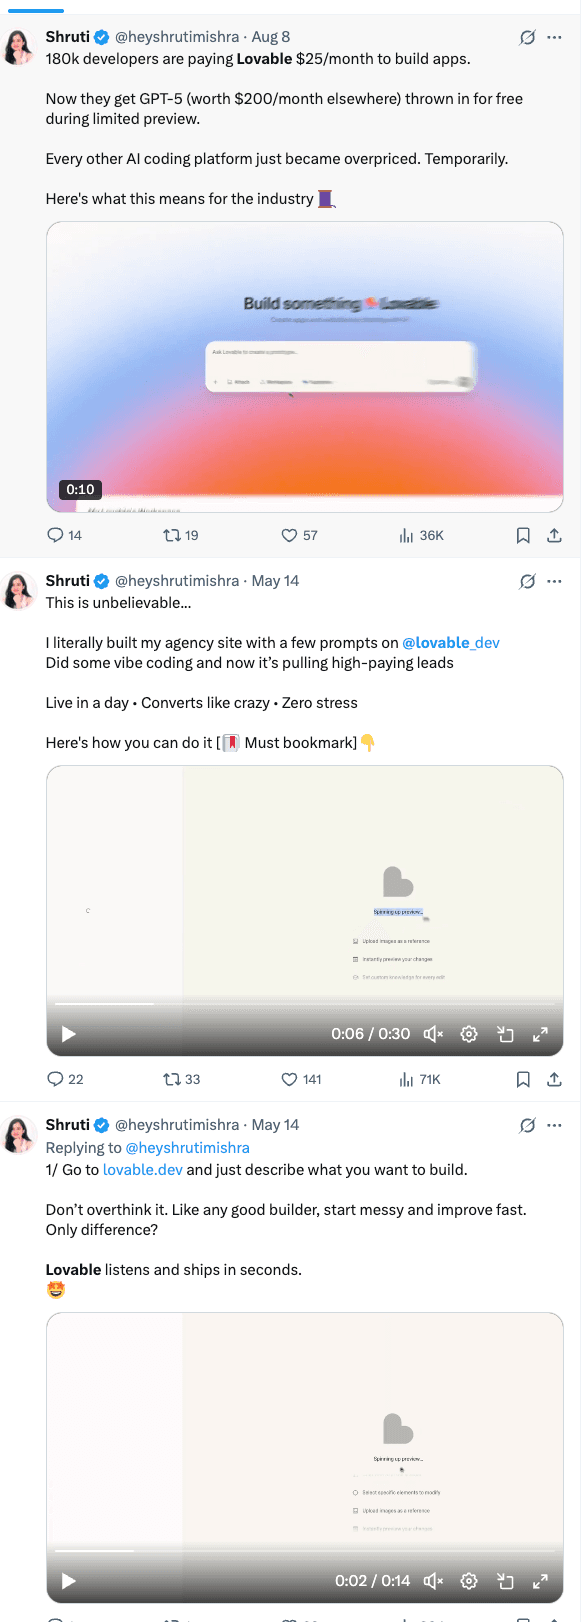
2. Showcases & Tutorials
In this category, creators demonstrate how they’ve used Lovable to build websites, apps, or AI tools, often presenting it as an authentic, hands-on experience.They serve as powerful testimonials that showcase the tool’s versatility.
Example: Shruti’s post.
3. Product Walkthroughs & Reviews
These are more analytical deep dives that evaluate Lovable’s overall product performance and usability from multiple angles.
Example: D-Coder’s review post offers a detailed critique of Lovable’s workflow and interface.
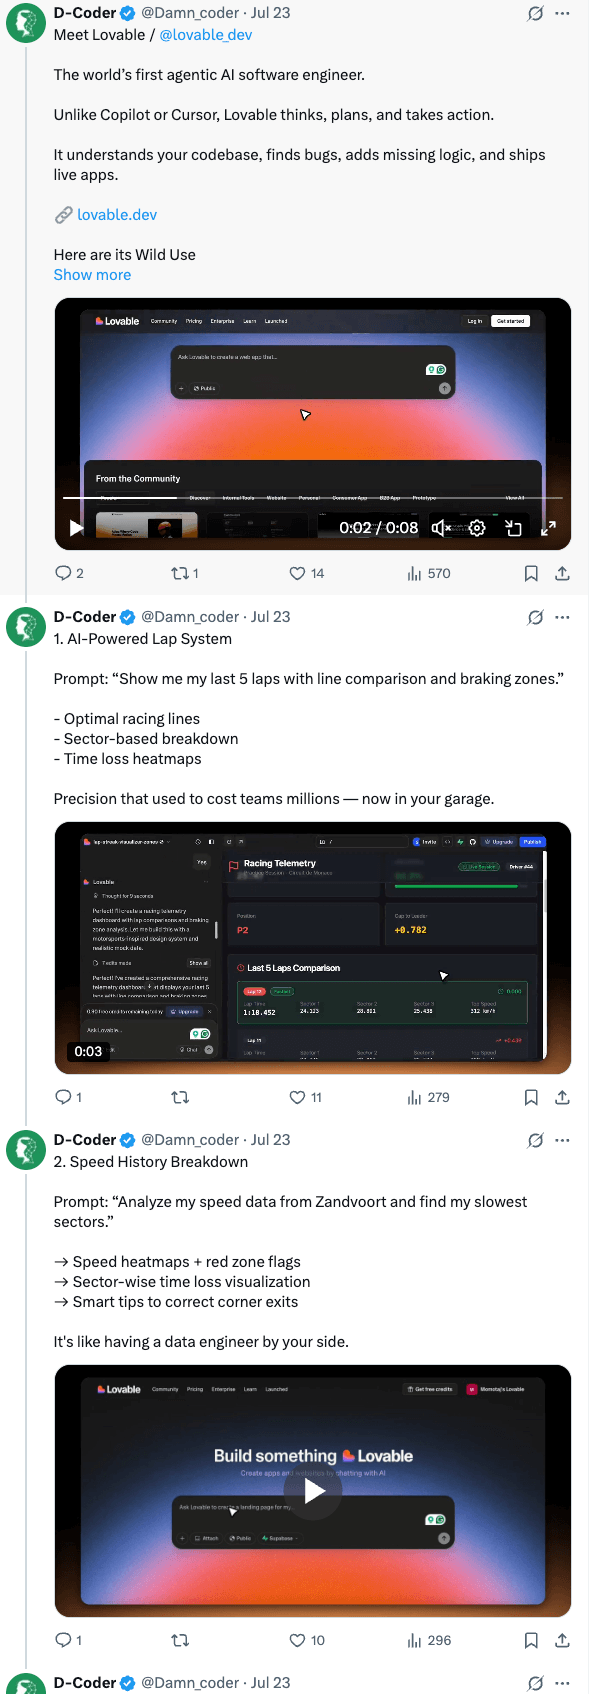
Collectively, these three content types reflect Lovable’s product-led confidence — both creators and users are drawn to its rapidly evolving capabilities and the ease of showcasing results. Beyond influencer-generated content, our analysis shows that Product Feature Update posts consistently achieve the highest engagement rates. For example, Lovable’s announcement of its Shopify integration ( see the original post here) garnered millions of views, with other feature-related updates performing at similarly impressive levels. This trend highlights how Lovable’s audience responds most strongly to innovation-driven narratives, where new functionalities spark genuine excitement and sharing momentum.
This trend reinforces that Twitter remains Lovable’s most effective channel for product updates and technical storytelling — where innovation narratives convert directly into visibility and community enthusiasm
Lovable’s Tiktok Strategy: Virality Through Use-Case Storytelling
Overview
Lovable’s influencer activity on TikTok gained visible traction between late June and early July 2025, marking the platform’s transition from casual mentions to structured brand visibility.
Amplift has identified 249 TikTok influencers who have promoted Lovable. Considering their follower counts, engagement rates, categories, and other metrics, the estimated total cost ranges from $95,000 to $140,000.
Although TikTok isn’t Lovable’s core audience hub — given its younger, entertainment-driven demographic — the platform has delivered strong organic reach (~2M total impressions) and a solid average engagement rate of 2.3%.
Lovable’s strategy leans on mid-tier creators and use-case storytelling, blending viral entertainment formats with product demonstrations. The brand achieves awareness not through polished ads, but through high-energy, shareable showcases that align with TikTok’s native culture — “shock, speed, and shareability.”
Key Takeaways & Actionable Insights
| Strategic Foucs | What Lovable Does | Actionable Insight / Technique You Can Apply |
|---|---|---|
| Platform Entry Timing | Began structured influencer push in late June–July 2025 | Time launches to coincide with viral AI/tool trends to ride discovery waves. |
| Influencer Quality over Quantity | 151 influencers, 78% rated A/S by Amplift. | Prioritize high-quality creators with proven engagement in tech/productivity niches. |
| Tier Balance | Mid-tier leads performance; Nano creators add organic reach. | Use a pyramid model: mid-tiers for conversions, nanos for grassroots advocacy. |
| Geographic Focus | Majority of creators and audiences are U.S.-based. | Leverage regional TikTok trends and sound patterns to localize appeal. |
| Optimal Video Length | Best engagement at 15–30s; 30–60s performs nearly as well. | Keep videos under 45 seconds — quick setup, visual demo, strong hook. |
| Top Content Style | Viral Build Showcases dominate (#lovable + #ai). | Replicate the “wow” formula — bold challenge + short build + big reveal. |
| Successful Hook Pattern | “I built [famous product] in X seconds using Lovable.” | Use cultural references to trigger curiosity and credibility. |
| Influencer as Ambassador | @noah_lousiana — small following but consistent brand focus. | Long-term collaboration with niche creators beats one-off campaigns. |
| Virality Formula | Humor + recognizability + product power + fast pacing. | Combine technical capability with entertainment to maximize reach. |
| Creative Philosophy | Virality = engineered consistency, not luck. | Treat TikTok as an experimentation lab — track hooks, sounds, and retention. |
Influencers: Quality Over Quantity — Mid-Tier Creators Lead the Way
Our analysis identified 151 influencers who produced 266 videos tagged with #lovable and #ai. According to Amplift’s influencer scoring system, within the AI productivity and tool niche, over 78% of these creators are rated “A” or “S”, underscoring Lovable’s strong focus on influencer quality rather than sheer volume.
In terms of follower distribution, mid-tier influencers dominate the network, followed by micro and nano creators. Although nano influencers account for a larger number of mentions, most of these are organic or unpaid references — a common phenomenon on platforms like TikTok, where user-generated amplification often extends the product’s visibility beyond paid collaborations.
Geographically, most of these influencers are based in the United States, indicating that the majority of views and resulting influence likely come from U.S. audiences. TikTok’s algorithm tends to prioritize distributing content within the same region where it was originally posted.
Influencer Tier Performance
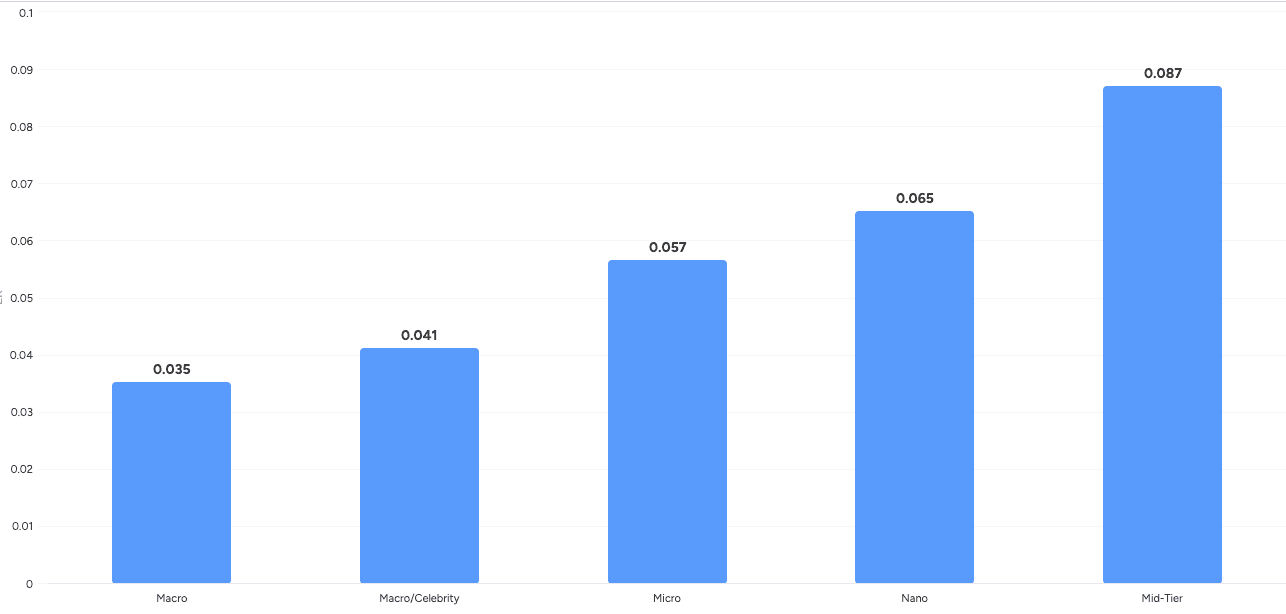
When breaking down engagement rates by influencer tier, Mid-tier influencers demonstrate the highest engagement potential, followed by Nano and Micro influencers, and then Mega/Celebrity influencers.
Macro influencers show the lowest engagement rate, suggesting that Mid-tier creators on TikTok offer the best balance between reach, authenticity, and performance efficiency — a valuable insight for marketing teams in related industries.
Content
Optimal Video Length
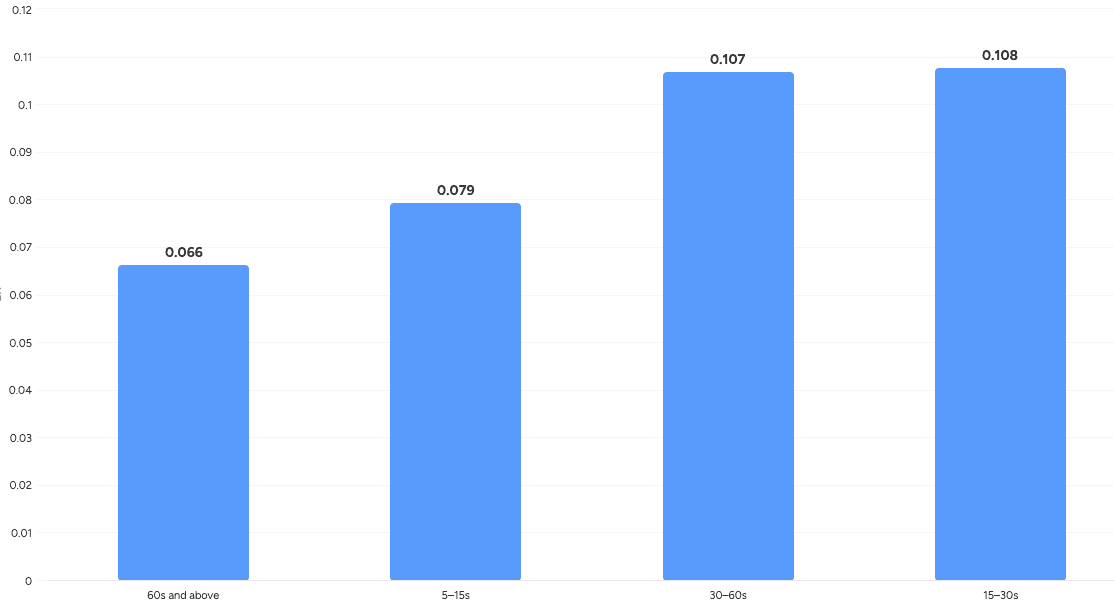
Analyzing engagement rates across different video durations, we found that 15–30 second videos perform best, delivering the highest average engagement rate. 30–60 second videos also perform strongly, achieving nearly identical results to the 15–30 second range.
In contrast, videos longer than 60 seconds show a noticeable drop in engagement — a finding consistent with TikTok’s preference for shorter, fast-paced content.
Content Analysis
Lovable’s TikTok influencer content can be categorized into four main types, each serving a distinct storytelling and engagement purpose:
1. Use-Case Demonstrations
This is the most dominant category, showcasing how users build or create with Lovable. It can be further divided into two subtypes:
Regular IRL Use Cases – Content that walks viewers through realistic applications, such as “Building a beautiful portfolio with Lovable in two minutes.” These videos tend to include more context and storytelling, offering a mini-tutorial experience.
Example: U can vibe build stores nowViral Build Showcases – Short, high-impact clips with dramatic hooks like “ChatGPT is dead — I built Google Maps in five minutes with Lovable.” These focus on speed and wow-factor, offering a quick visual blast of the creation process rather than a detailed explanation.
Example: Build Windows 11 using Lovable
2. Quick Product Walkthroughs
These videos highlight 2–3 standout features of Lovable, often designed to spark curiosity and drive click-throughs. Typical titles include:
“Use this app (Lovable) to build your own website without writing a single line of code.”
They function as product teasers — concise, visually engaging, and focused on showing Lovable’s power in seconds.
Example: They say making a website in a day is impossible…
3. Tutorials & Educational Videos
This category leans toward business, productivity, and entrepreneurship content. Influencers often frame Lovable as a tool for building startups or income-generating products, using headlines such as:
“How I used Lovable to create a business that earns thousands a day.”
These videos are positioned as educational yet aspirational, appealing to creators and founders who want to learn and build simultaneously.
Example: Complete Lovable Guide
4. News Blasts & Product Updates
These videos focus on new features, updates, and technological advancements. Since Lovable releases new capabilities at a rapid pace, this format performs well for real-time engagement and product discovery.
Example: Everything you need to know about the new Shopify x Lovable collaboration
Among all the formats above, Use-Case Demonstration content — particularly the Viral Build Showcase style — consistently drives the highest virality and engagement. TikTok audiences seem especially drawn to these fast-paced, high-drama builds where creators use Lovable to “outcompete big brands” like ChatGPT or Claude.
The most successful posts share a few common traits:
A provocative headline comparing Lovable to a major brand or product.
A quick visual montage of the build process.
A final reveal emphasizing the impressive end result.
For example, the TikTok video titled “Building Call of Duty in 60 Seconds” (1.8 million views, 73 thousand likes)
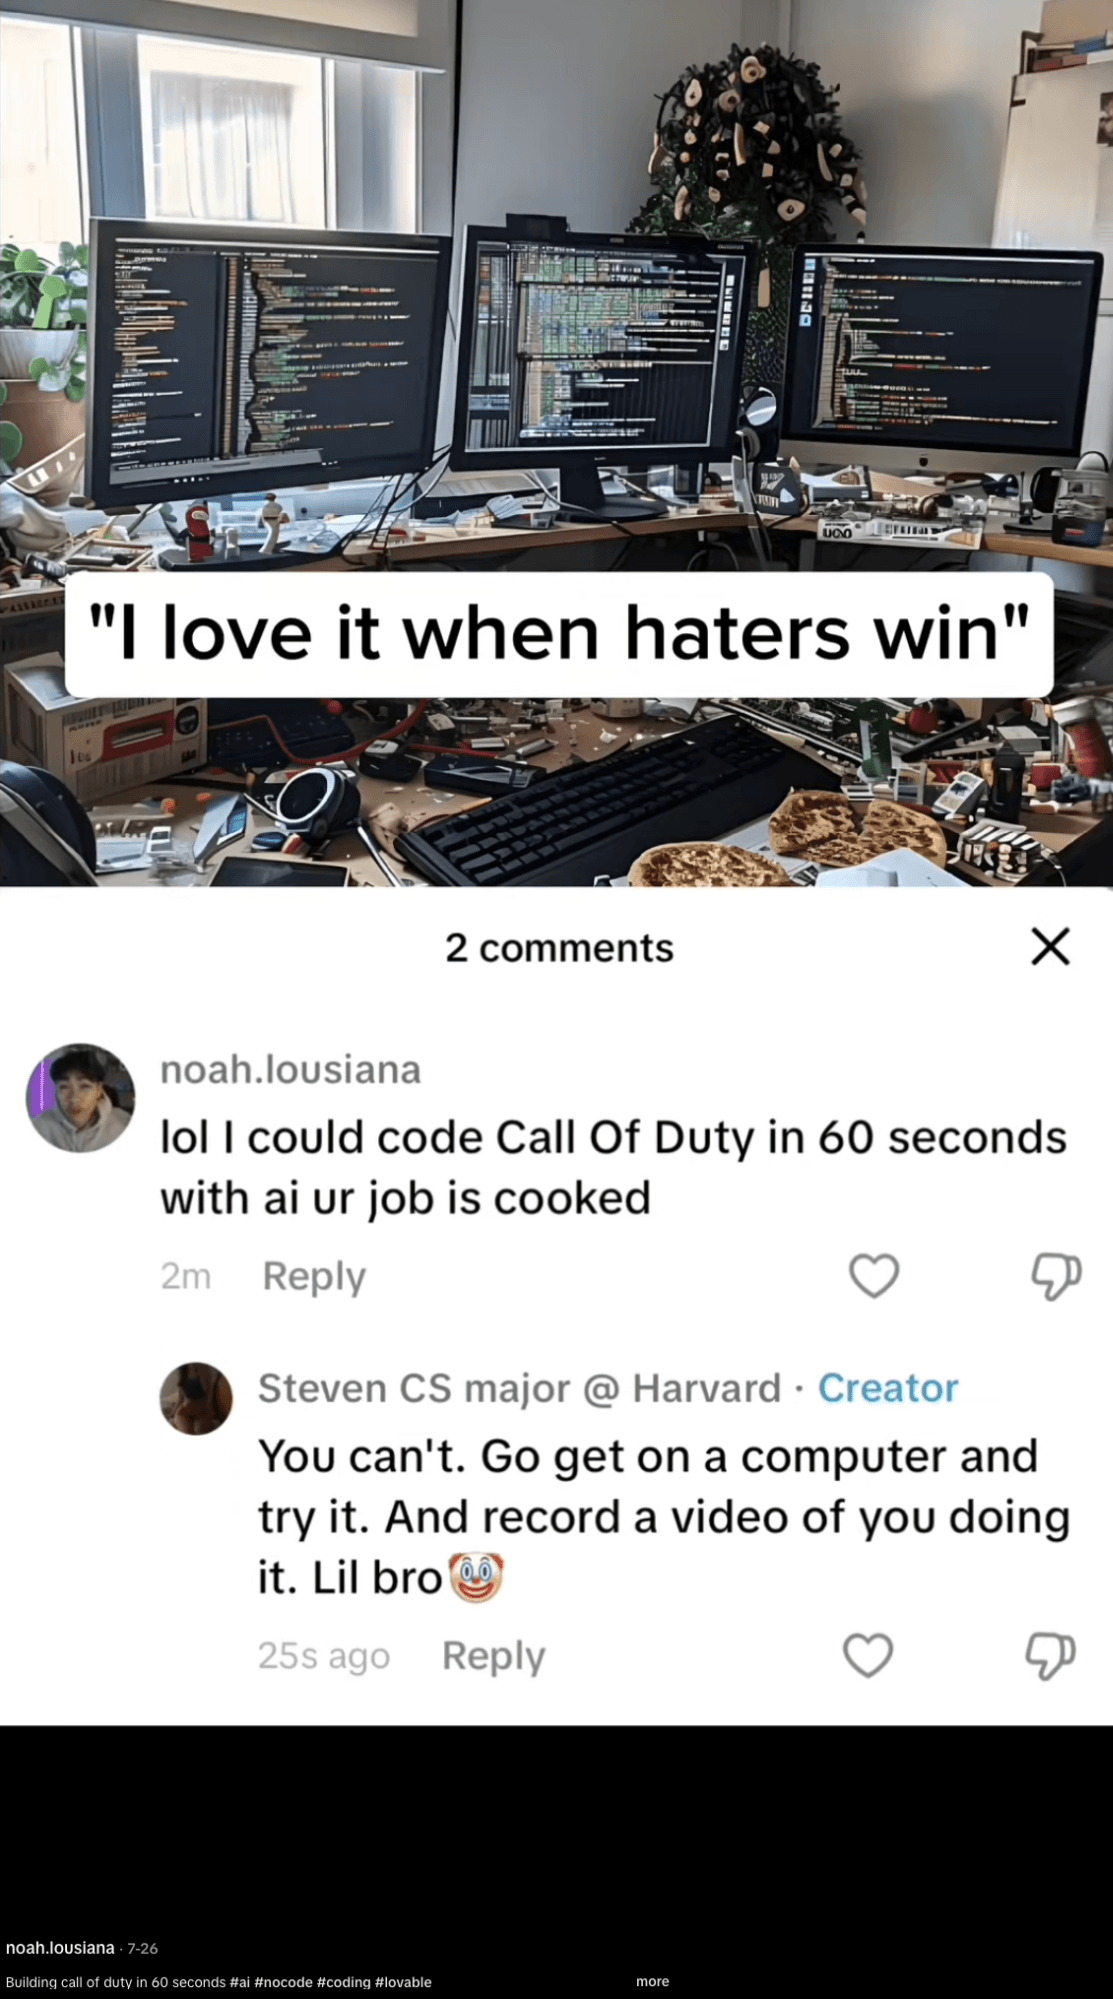
In this video, the creator begins by showing a screenshot of a heated comment debate. The creator had previously claimed, “I could code Call of Duty within 60 seconds using AI — your job is cooked.” One commenter challenged him to prove it, setting up a perfect hook that immediately captures audience attention.
The video then cuts to a demonstration where a girl uses ChatGPT (for game description and prompt generation) alongside Lovable, successfully building a new version of Call of Duty almost instantly. She even plays the generated game on camera, adding humor and playful gestures that make the content entertaining and relatable.
This video encapsulates the ideal TikTok formula — shock, speed, and shareability. It highlights Lovable’s technical power (building a complete game from a single sentence) while keeping the tone fun and culturally relevant. Leveraging a globally recognized game title like Call of Duty only amplified its virality, making the video both a product showcase and a viral entertainment piece — positioning Lovable as powerful, creative, and accessible to everyone.
An interesting point about this video is that its creator, @noah_lousiana, has a relatively modest following of 25.4K, yet he appears to be one of the long-term collaborators working with Lovable — as suggested by the unique referral code displayed in his TikTok bio. His content consistently revolves around using Lovable to build large-scale or recognizable tools — from Excel and Google Maps to Windows and iOS replicas.
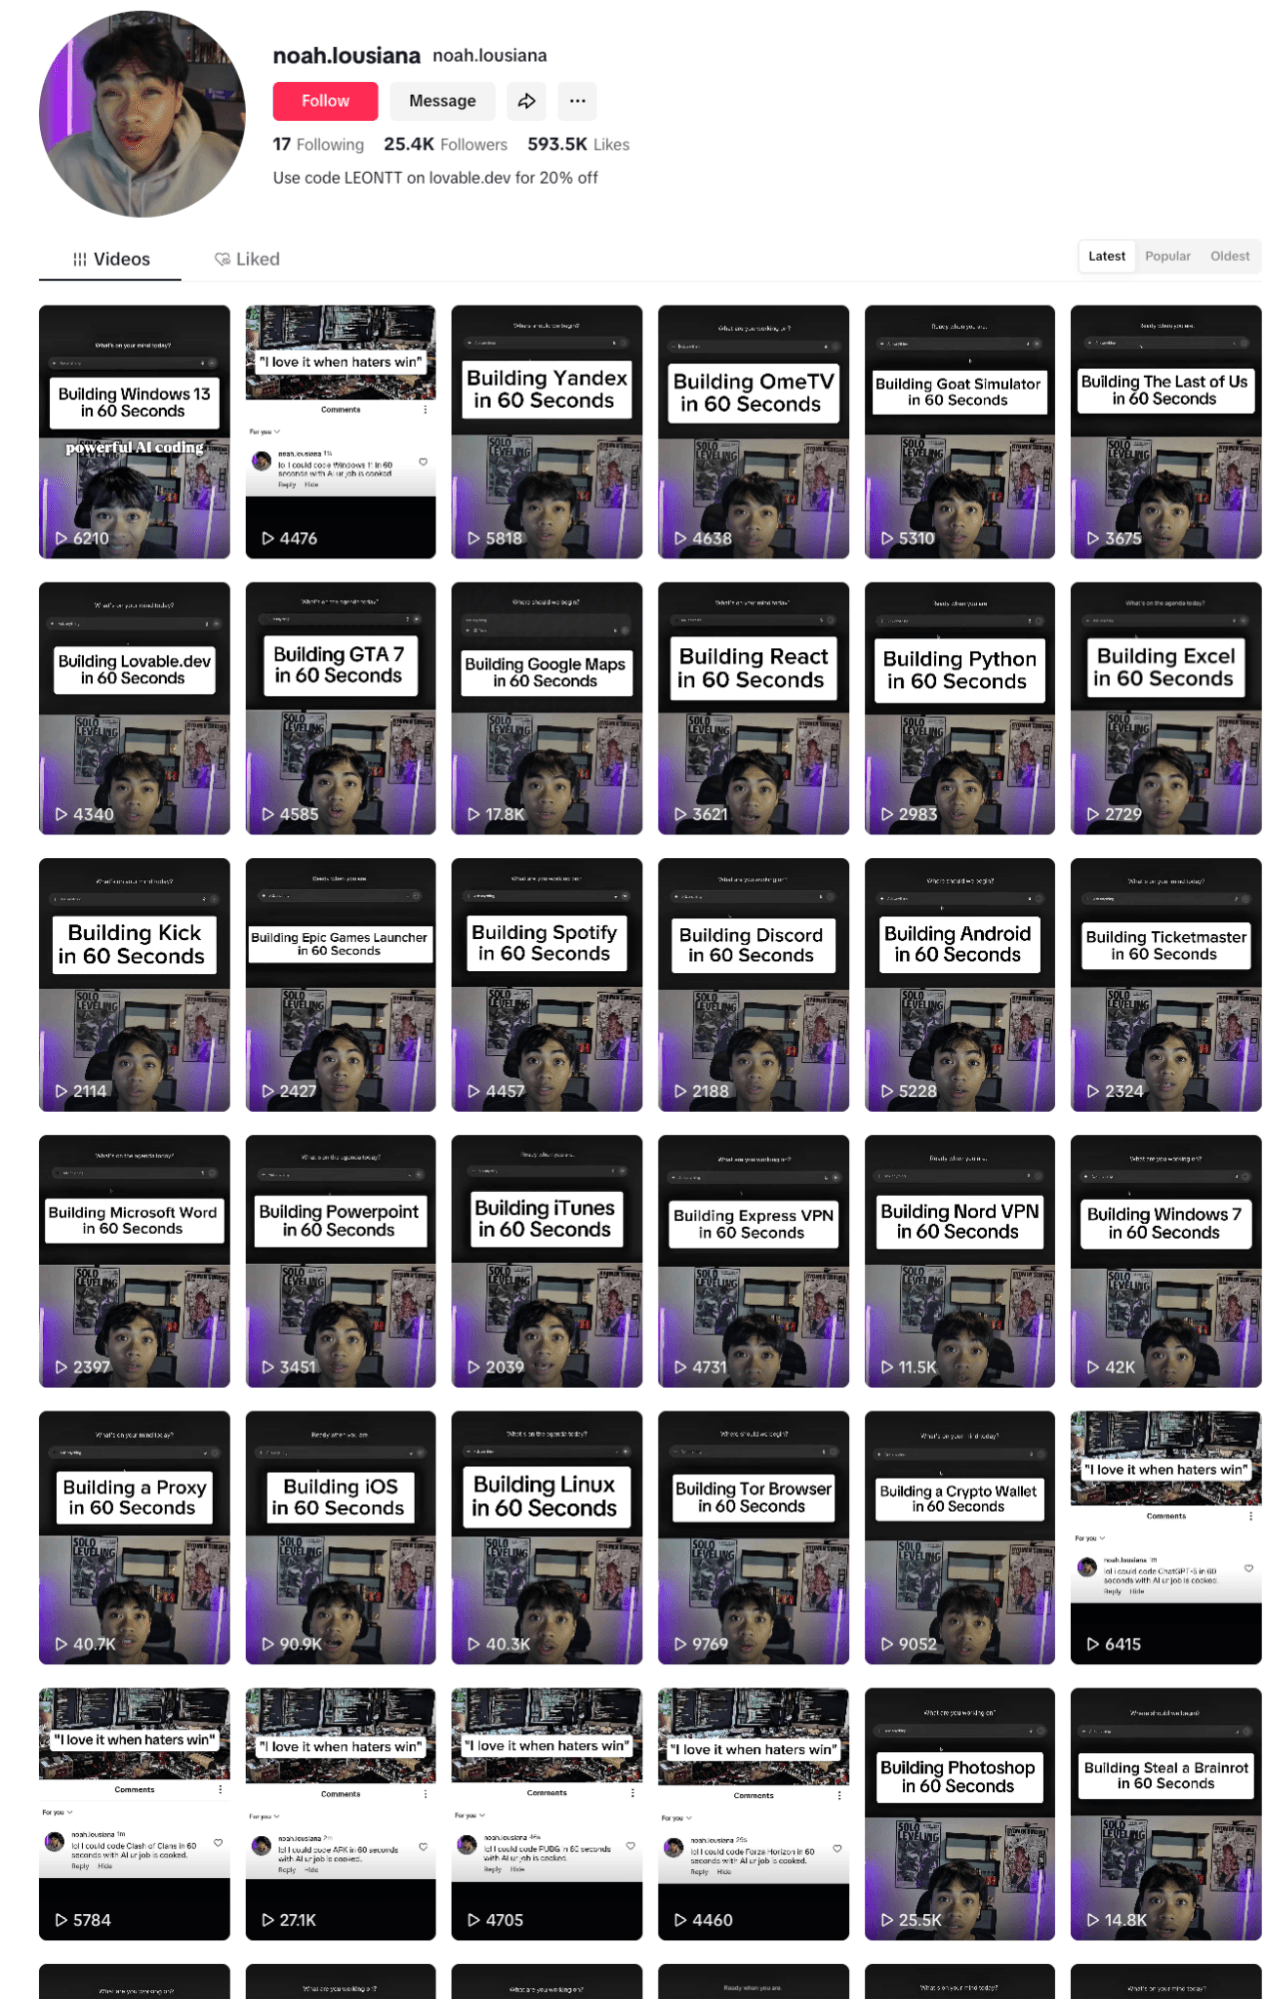
Among his uploads, the “Building Call of Duty in 60 Seconds” video stands out as his most viral post to date, while another video demonstrating how to build iOS with Lovable also gained notable traction.
This case illustrates an important lesson in influencer marketing: there are no guaranteed formulas for success. Ongoing experimentation with different creative approaches, formats, and hooks is essential for finding what truly connects with your audience. Viral growth is seldom a matter of luck; it stems from regular testing, learning, and refining your strategies. As this example demonstrates, achieving virality is not a coincidence; it is crafted through dedication, iteration, and thoughtful storytelling.
Building Authenticity Through Community: Lovable’s Organic Influence on Instagram
Compared to its high-volume activity on X and YouTube, Lovable’s Instagram strategy is subtle yet strategically authentic. The platform acts as a hub for organic advocacy, user-generated content (UGC), and peer-driven storytelling, where creators share genuine experiences rather than formal collaborations.
Overview:
We identified approximately 164 posts that are likely collaborative or co-created influencer content mentioning Lovable. Collectively, these posts reached an estimated 8.5 million users worldwide, demonstrating respectable organic reach for a relatively young AI brand.
Performance metrics show that Lovable’s influencer content performs above market average:
Average engagement rate: 0.46 %
58.94 % of posts perform at or above the average market engagement rate
64.46 % perform better than the influencers’ usual benchmarks
77.27 % of participating influencers have a high-quality, active audience
This suggests strong cost efficiency and high authenticity in influencer collaborations.
The estimated cost-per-engagement (CPE) is around $1.7, and the overall estimated budget, considering both sponsored and likely sponsored collaborations, is approximately $30.8k - $92.8k.
Top performing hashtags include #lovable and #lovabledev, further reinforcing the brand’s discoverability and creator-community awareness.
Key Takeaways & Actionable Insights
| Key Tactic | Strategic Role / Data-Backed Result | Actionable Insight |
|---|---|---|
| Sustain Community Trust via UGC | The platform's role is to maintain ongoing connection after initial conversion through organic UGC, micro-tribes, and peer-to-peer storytelling. | Focus on empowering users and micro-communities to generate and share authentic content, using the channel for community reinforcement and loyalty. |
| Target Core Age Demographic | The core audience is heavily skewed toward the 25–34 age group (the digital-native professional segment). | Partner with creators who are active digital-native professionals in the 25–34 age range to ensure content resonance. |
| Cultivate Micro-Tribes | The strategy emphasizes the importance of maintaining active micro-tribes to fuel community-driven growth and loyalty. | Actively cultivate smaller, niche communities to drive organic connection and content sharing among highly engaged users. |
| Emphasize Cost-Efficiency | The channel is highly efficient, achieving an 8.5M estimated reach with a competitive estimated budget of approx. $30.8k-$92.8k and low ~$1.7 CPE. | Use Instagram as a cost-efficient channel for building social proof and sustaining reach with authentic endorsements. |
| Optimize Posting Time | Analysis noted Wednesday 2–3 a.m. as a peak time for engagement. | Test and refine the content publishing schedule to align with the noted peak window to maximize the visibility and performance of community-focused posts. |
| Acknowledge Platform Role | The strategic role is explicitly defined as sustaining connection, not being a primary engine for top-of-funnel growth or education. | Keep the content strategy focused on loyalty and community building, rather than using it for broad, costly awareness campaigns. |
---
Influencers
👤 Influencer Tier
Mid-tier influencers represent the largest share of Lovable’s collaborations, accounting for 43.9% of all partnered creators. Micro influencers follow at 24.2%, while Nano, Mega, and Macro influencers make up smaller portions in descending order.
This tier distribution suggests that as a fast-growing but relatively new brand, Lovable strategically prioritizes mid-tier and micro influencers — segments known for offering the best balance between reach, engagement, and cost efficiency.
These creators typically maintain close community relationships, making their endorsements feel authentic while still driving measurable awareness.
🪞 Influencer Persona
Of the 66 influencers identified, 97% are individual influencers.
Demographically, 65% of influencers are aged between 25–34, representing the core group of digital-native professionals and early tech adopters. The gender distribution is well balanced — 54.1% female and 45.9% male — allowing Lovable to maintain a broad appeal across creator niches.
Content-wise, most influencers have previously promoted AI or tech-related products, with the Computers & Gadgets and Business & Careers categories leading in representation. Smaller clusters emerge in Lifestyle, Humor, and Entertainment, which add a touch of relatability and cultural reach to Lovable’s influencer narrative.
According to Amplift’s influencer quality scoring system, over 88% of these creators rank above average in quality compared to peers in similar niches. This demonstrates strategic precision in Lovable’s influencer selection — focusing not just on follower count, but on audience authenticity, engagement health, and brand alignment.
Example: _designanything
Category for this influencer: sales & marketing, unboxing, workwear, business,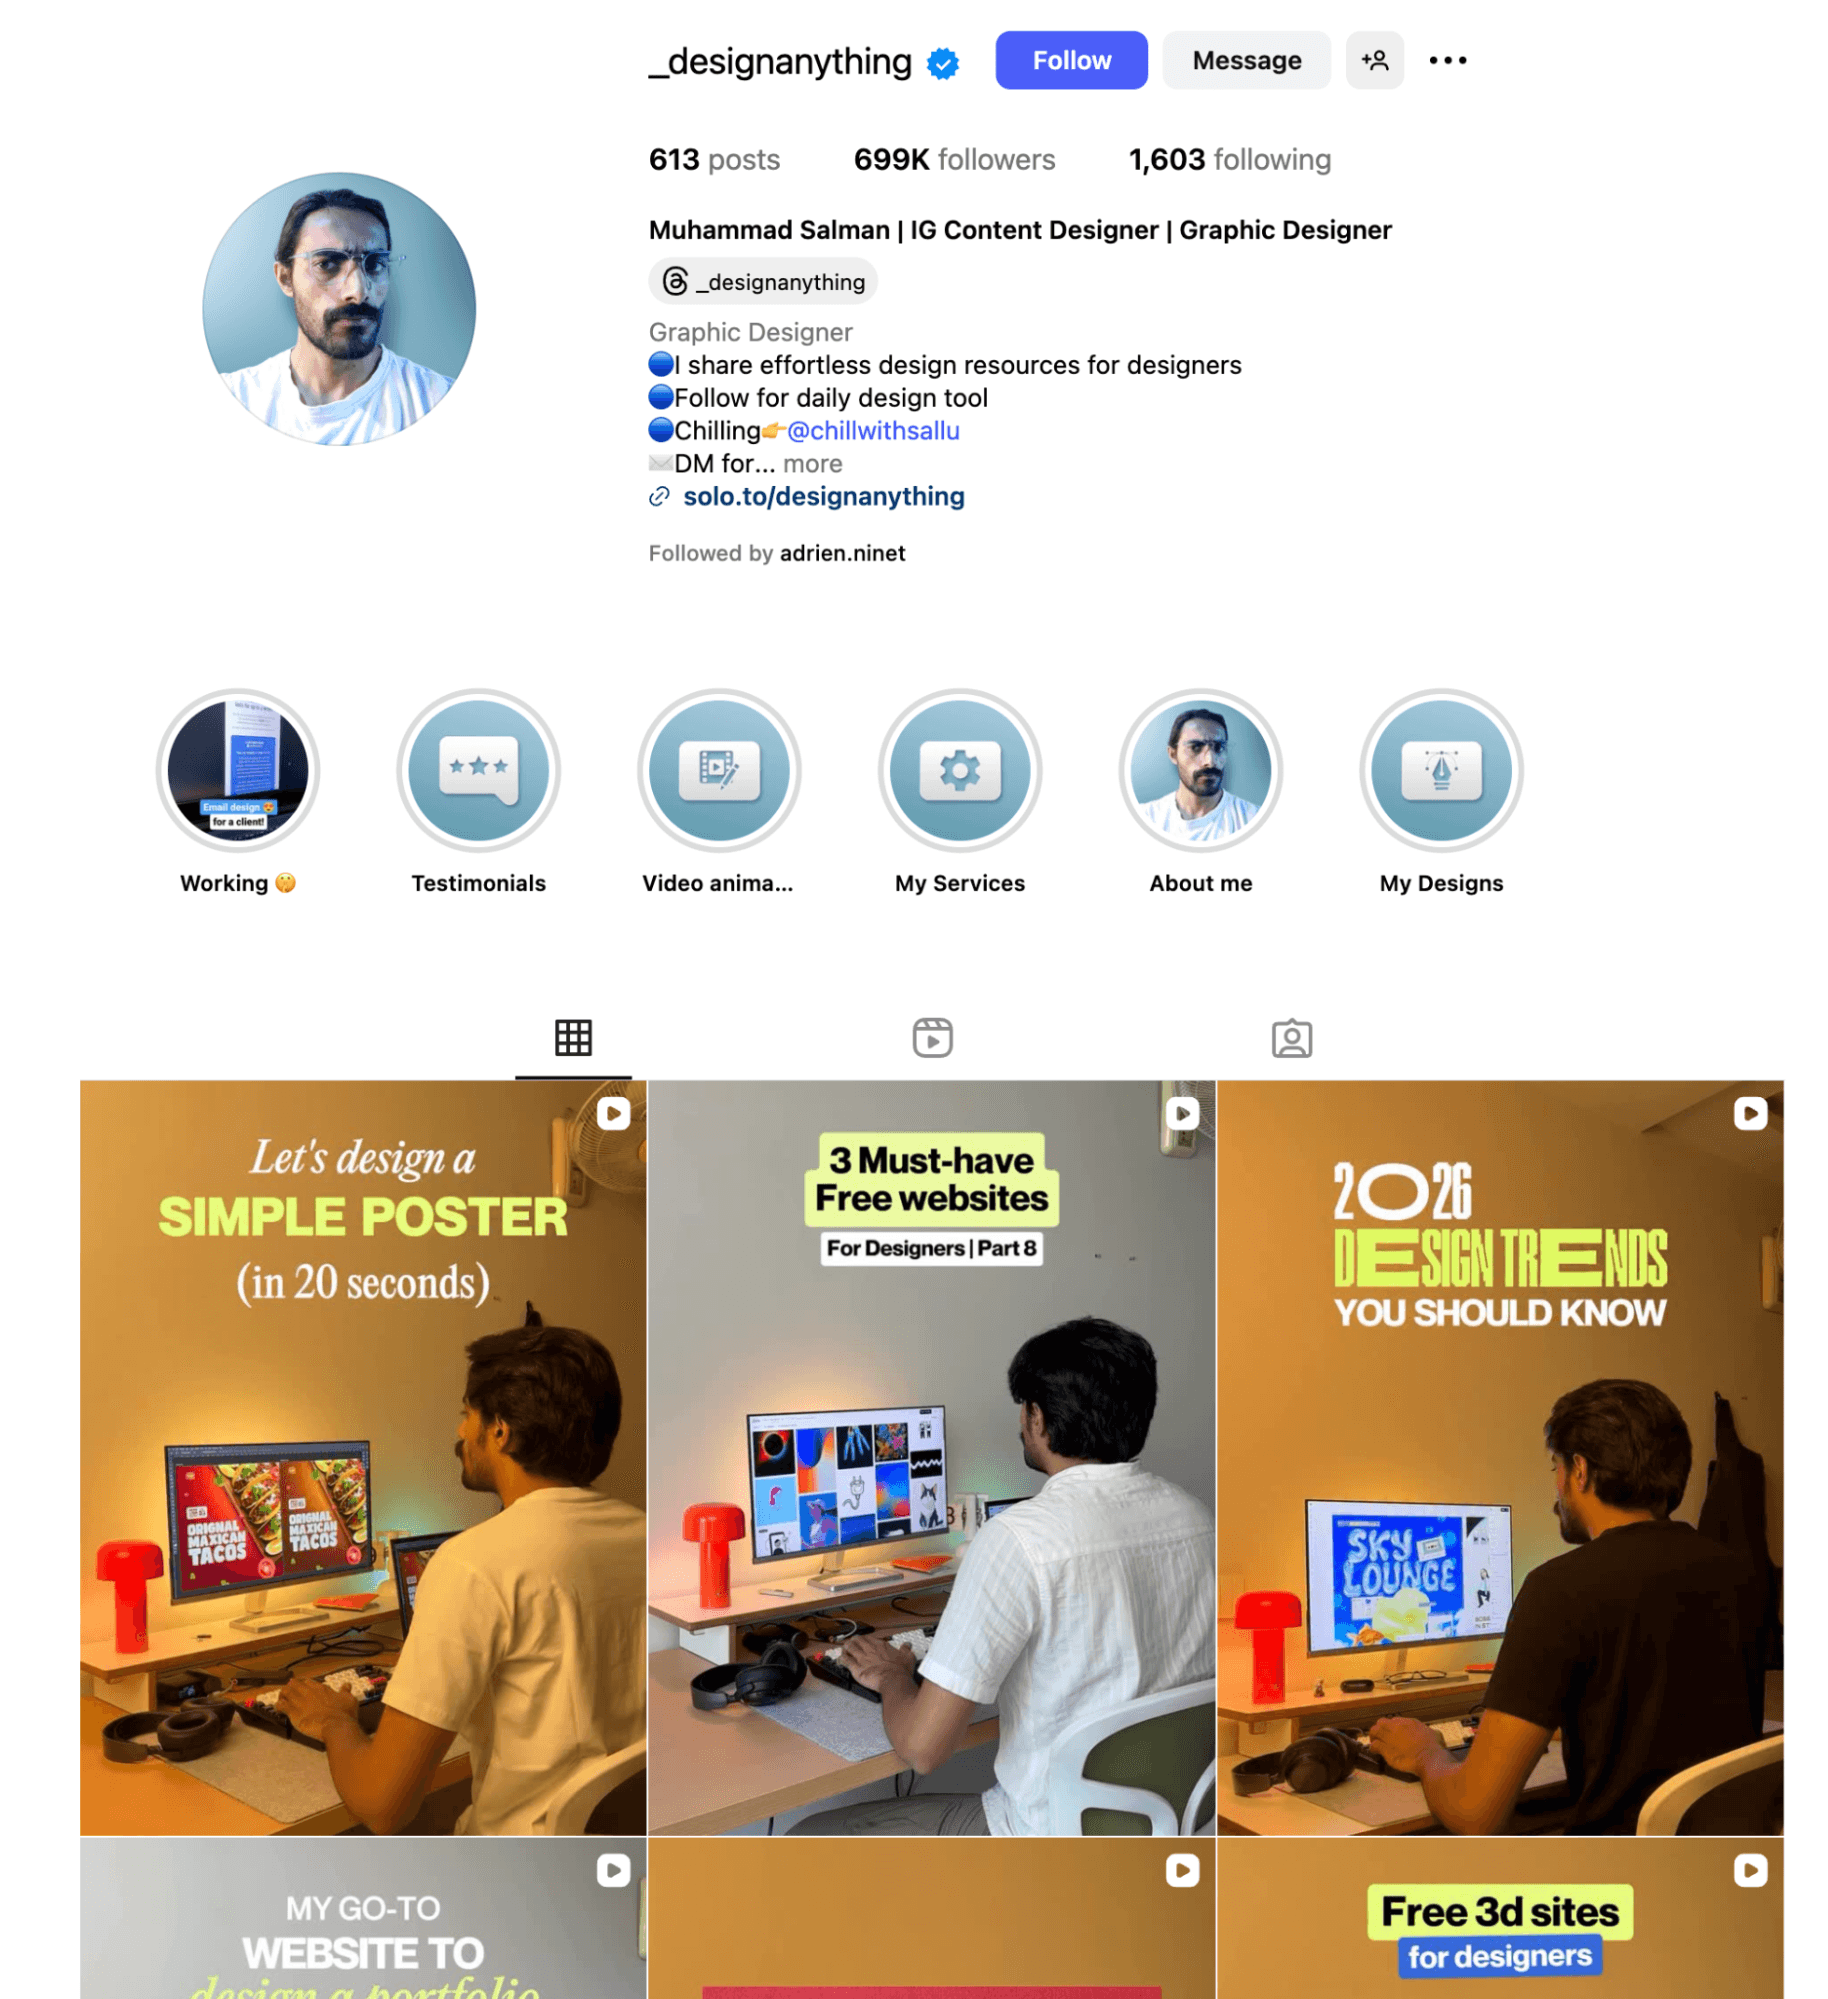
Audience
Lovable’s Instagram audience across its influencer network appears highly concentrated and demographically consistent, reflecting strategic alignment between influencer selection and target user base.
Audience Demographics
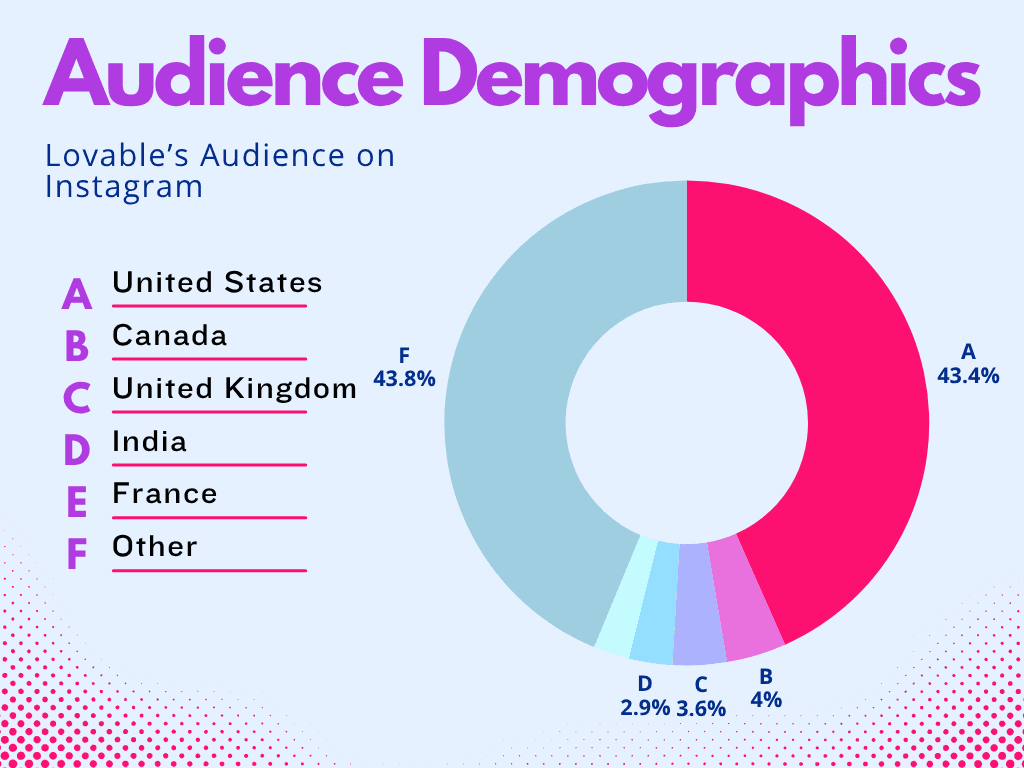
Approximately 39.7% of Lovable’s audience is based in the United States, making it the brand’s primary market. The second-largest audience cluster comes from India (5.8%), while the remaining audience is widely distributed across other countries without a clear descending pattern — indicating Lovable’s growing international reach beyond English-speaking regions.
Within the U.S., Los Angeles and Miami stand out as the top audience hubs, both known for vibrant tech and creator communities, suggesting strong brand resonance among creative professionals and early adopters.
Gender distribution is moderately male-skewed, with 61.6% male and 38.3% female followers — a fairly balanced mix for a tech-focused AI brand.
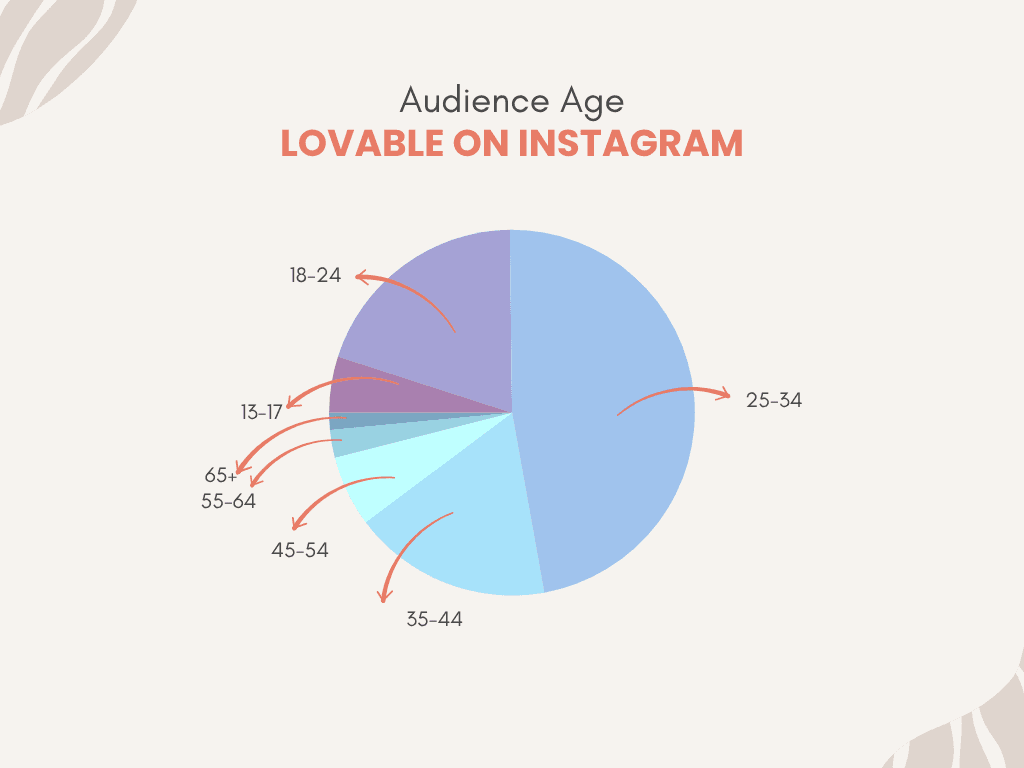
From an age perspective, the 25–34 segment represents the largest portion (47%) of the total audience, aligning closely with the age group of Lovable’s influencer partners. This alignment between influencer demographics and audience composition indicates deliberate, data-informed targeting — ensuring that content not only fits influencer profiles but also resonates deeply with their followers.
Engagement Quality and Comment Sentiment Analysis
On average, posts about Lovable receive around 381 likes and 91 comments each — solid engagement figures.
Sentiment analysis of the comment sections reveals a strong lean toward positivity: 47% of interactions express favorable opinions, while only 3% reflect negative sentiment, with the remainder being neutral or descriptive in nature.
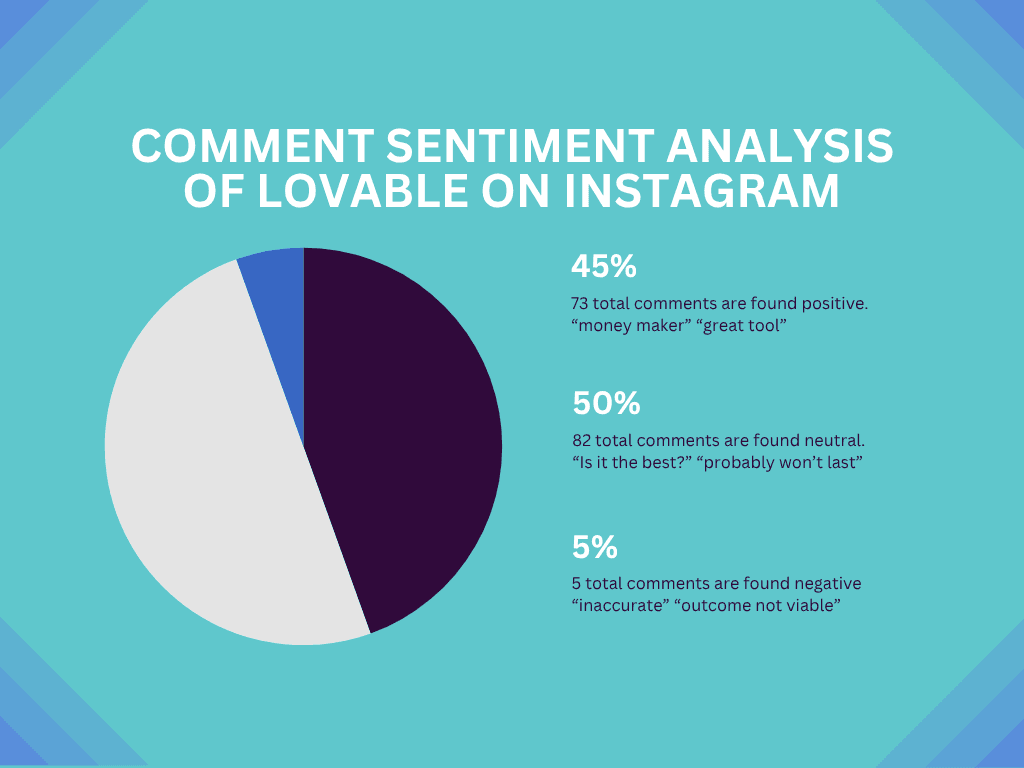
Conversations around Lovable center heavily on its Shopify integration, AI productivity features, and ease of building websites or apps — positioning the brand as an accessible, creative, and time-saving AI tool for entrepreneurs and creators.
Repost & UGC reshares
Between late September and now, over 700 mentions of Lovable have been found on Instagram — the majority being user-generated content (UGC) rather than influencer posts. The most common content themes include:
Feature highlights – users showcasing the best functions or updates of Lovable.
Example: “Dating website 💙⚡️ Build Full-Stack Apps Like Never Before”Personal use cases or success stories
Example: “Pov: You finally got hired…after building your portfolio the right way.”How-to guides and walkthroughs – step-by-step posts educating others on how to build faster with AI.
Example: “Create stunning landing pages with Midjourney and Lovable.”
Positive mentions often highlight how Lovable speeds up app development, backed by data or screenshots that strengthen its credibility.
Example: “Built my SaaS MVP with Lovable in just 2 hours — insane productivity boost!”
Negative mentions are rare and mostly reflect general AI skepticism or bubble concerns rather than issues with the product itself.
Example: “This is wild — can’t tell if AI building apps this fast is the future or the beginning of the bubble.”
Overall, the sentiment shows Lovable’s Instagram community is highly engaged, authentic, and supportive — with users organically fueling brand conversations through genuine experiences, a hallmark of a healthy, self-sustaining community.
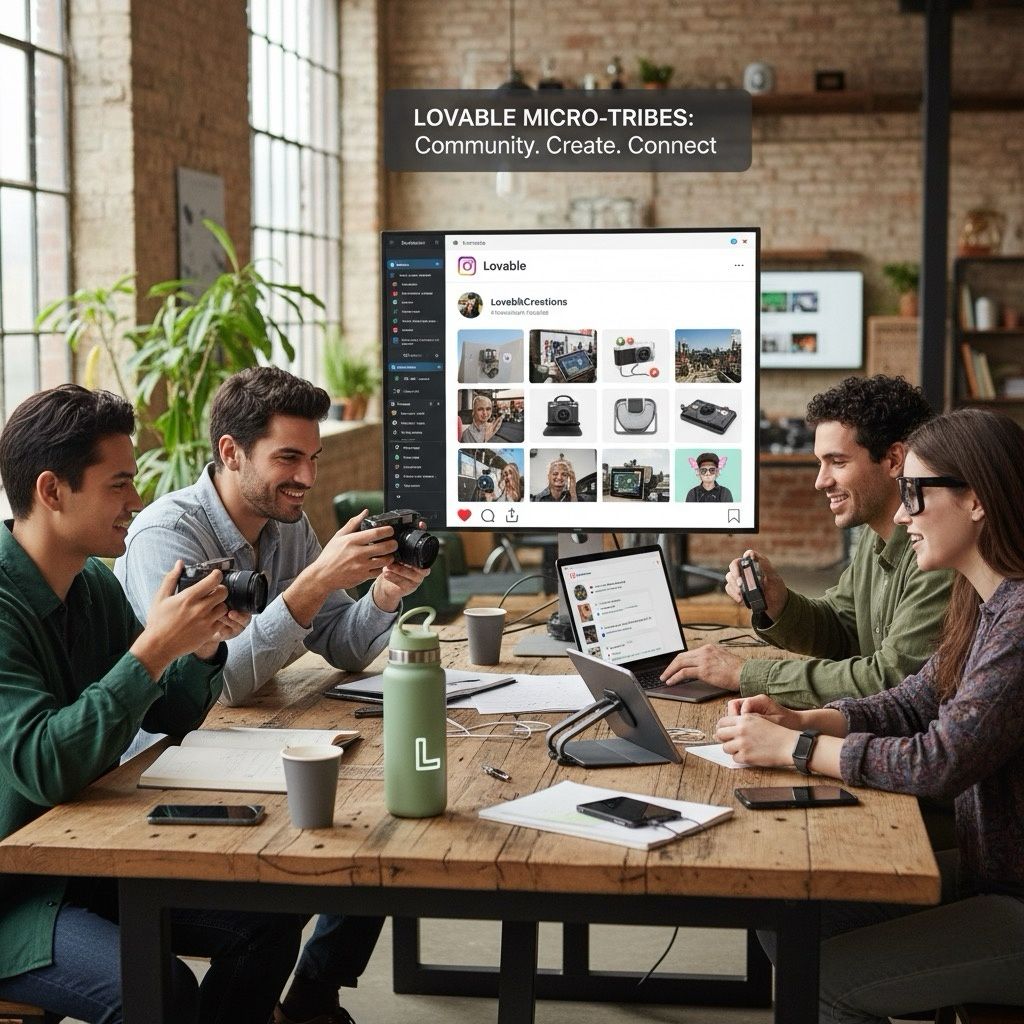
Community Cohesion & Micro-tribes
On Instagram, where content is largely community-driven and user-generated, several micro-tribes have emerged around Lovable. These are smaller yet highly active creator groups that consistently share content, discuss product features, and exchange ideas. While their audience sizes may be modest, their engagement is deep — reflecting an authentic, grassroots enthusiasm for the brand within niche creative and tech communities.
Content
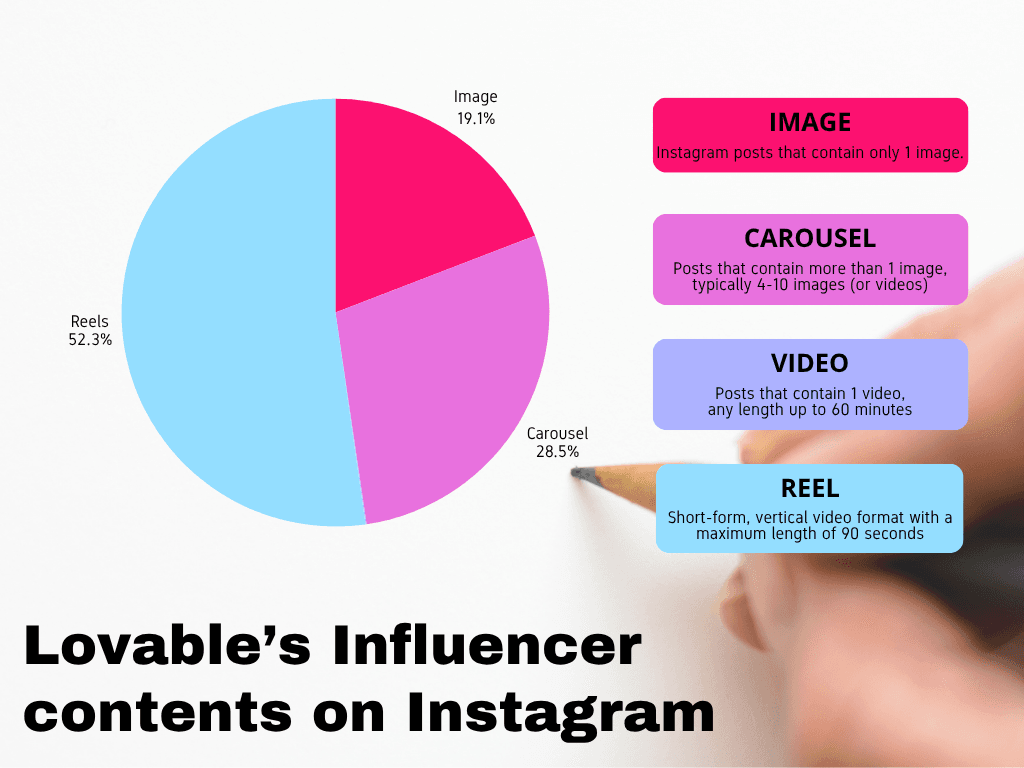
The majority of influencer content about Lovable appears in the form of Reels, which account for 52.3% of all posts. Carousels follow with 28.5%, while static image posts make up the remaining 19.1%. This distribution highlights Lovable’s focus on dynamic, visual storytelling, leveraging Reels as the most engaging format for demonstrating product capabilities and creator experiences.
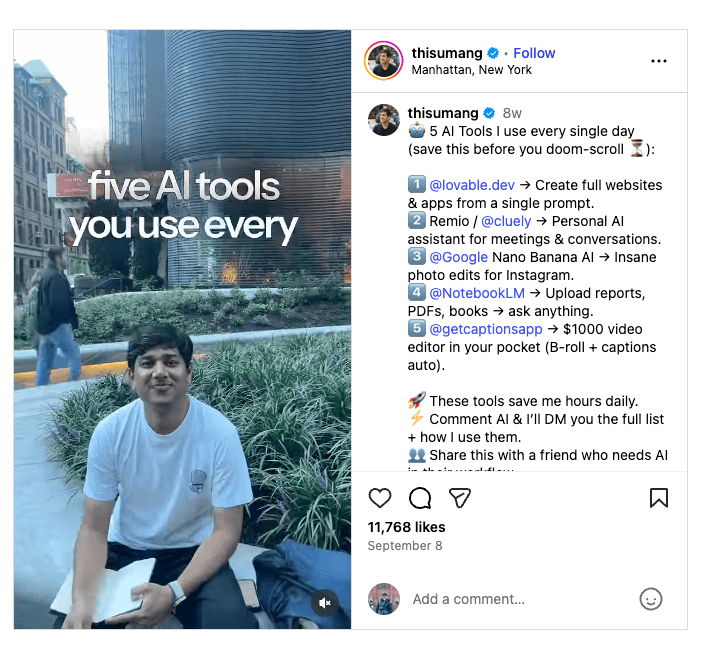
Below is one of the most engaging Instagram posts about Lovable — a strong example of how short-form video effectively captures attention and drives interaction.
In terms of posting behavior, influencers collaborating with Lovable tend to achieve higher engagement rates on Wednesdays, particularly between 2:00 and 3:00 a.m. (UTC).
Lovable-related content is consistently shared throughout the week, indicating that creators post naturally rather than adhering to a strict campaign schedule. This pattern further enhances the authenticity of Lovable’s influencer community.
Conclusion: The Blueprint Behind Lovable’s Influencer Mastery
Lovable’s rise isn’t just another AI success story — it’s a masterclass in precision, authenticity, and platform fluency. Across every channel, the brand blends product excellence with creator intelligence, turning community energy into measurable growth momentum.
On YouTube, Lovable builds trust through long-form education and credible creator voices.
On X (Twitter), it leads conversations through founder visibility and real-time storytelling.
On TikTok, it turns product demos into viral entertainment.
On Instagram, it strengthens brand affinity through user-generated content, micro-tribes, and genuine peer advocacy.
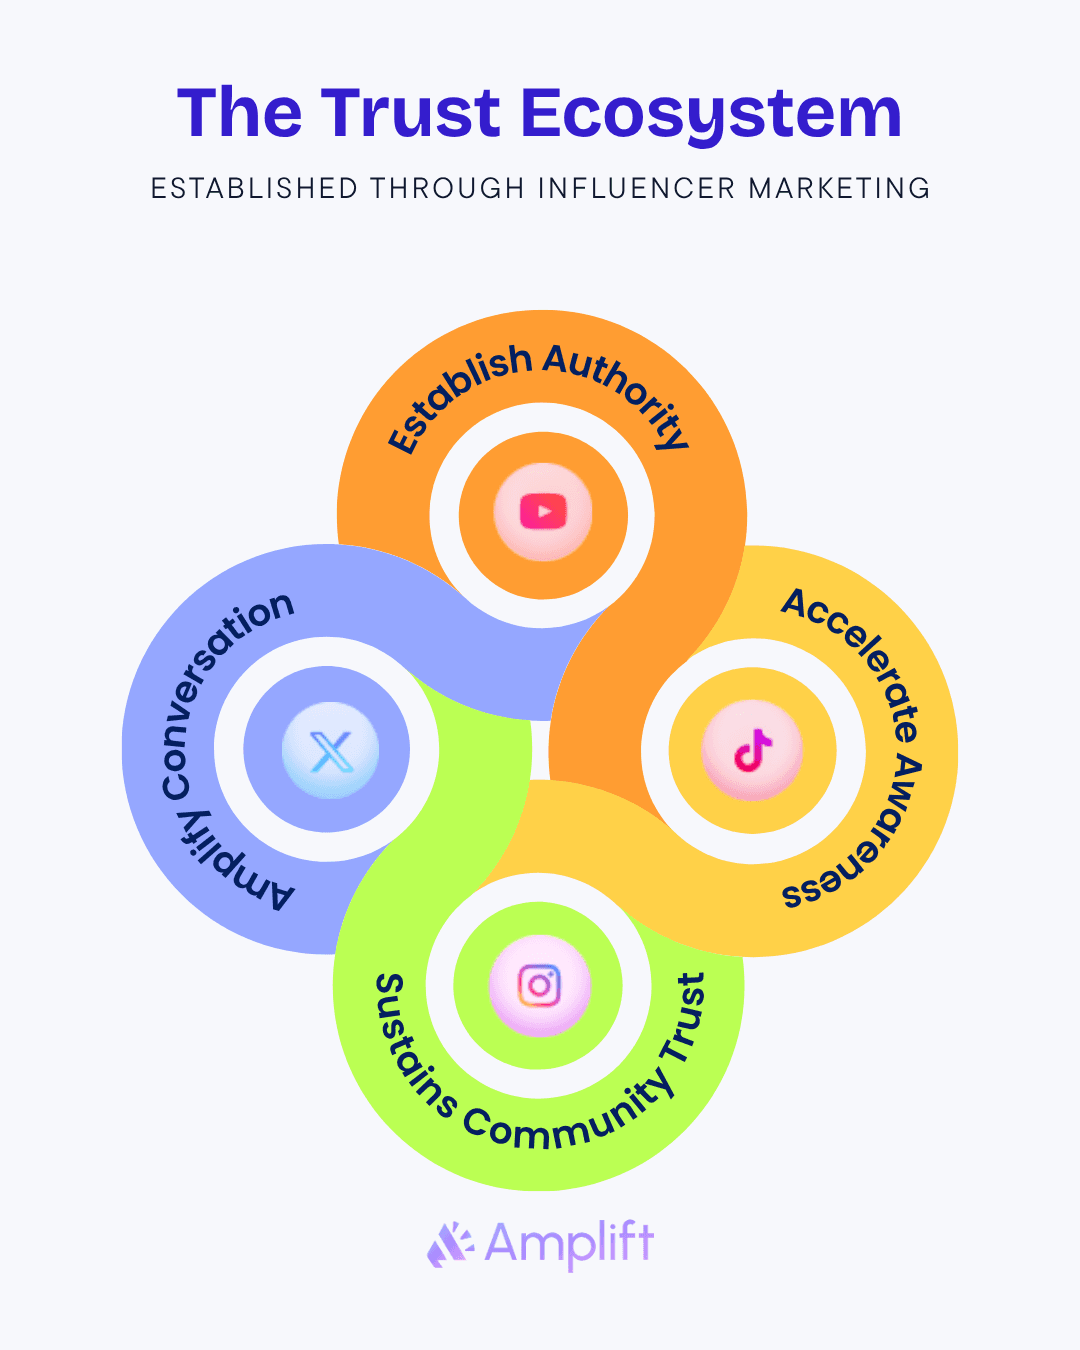
Each platform plays a distinct role —
🎥 YouTube establishes authority.
💬 Twitter (X) amplifies conversation.
📱 TikTok accelerates awareness.
📸 Instagram sustains community trust.
This isn’t random channel synergy — it’s data-driven orchestration.
Lovable’s influencer strategy operates like a living ecosystem — product-led, insight-backed, and creator-powered. Its success comes not from chasing attention but from earning it, by letting creators demonstrate, teach, and build with the product itself.
With Amplift, we decoded this system layer by layer — analyzing creator quality scores, engagement health, and audience sentiment across thousands of posts and videos. Amplift’s intelligence makes the invisible visible: how trust forms, how virality compounds, and how authentic influence scales sustainably.
For marketers, the takeaway is clear:
In 2025, influence isn’t bought — it’s engineered. Amplift can do it for you.
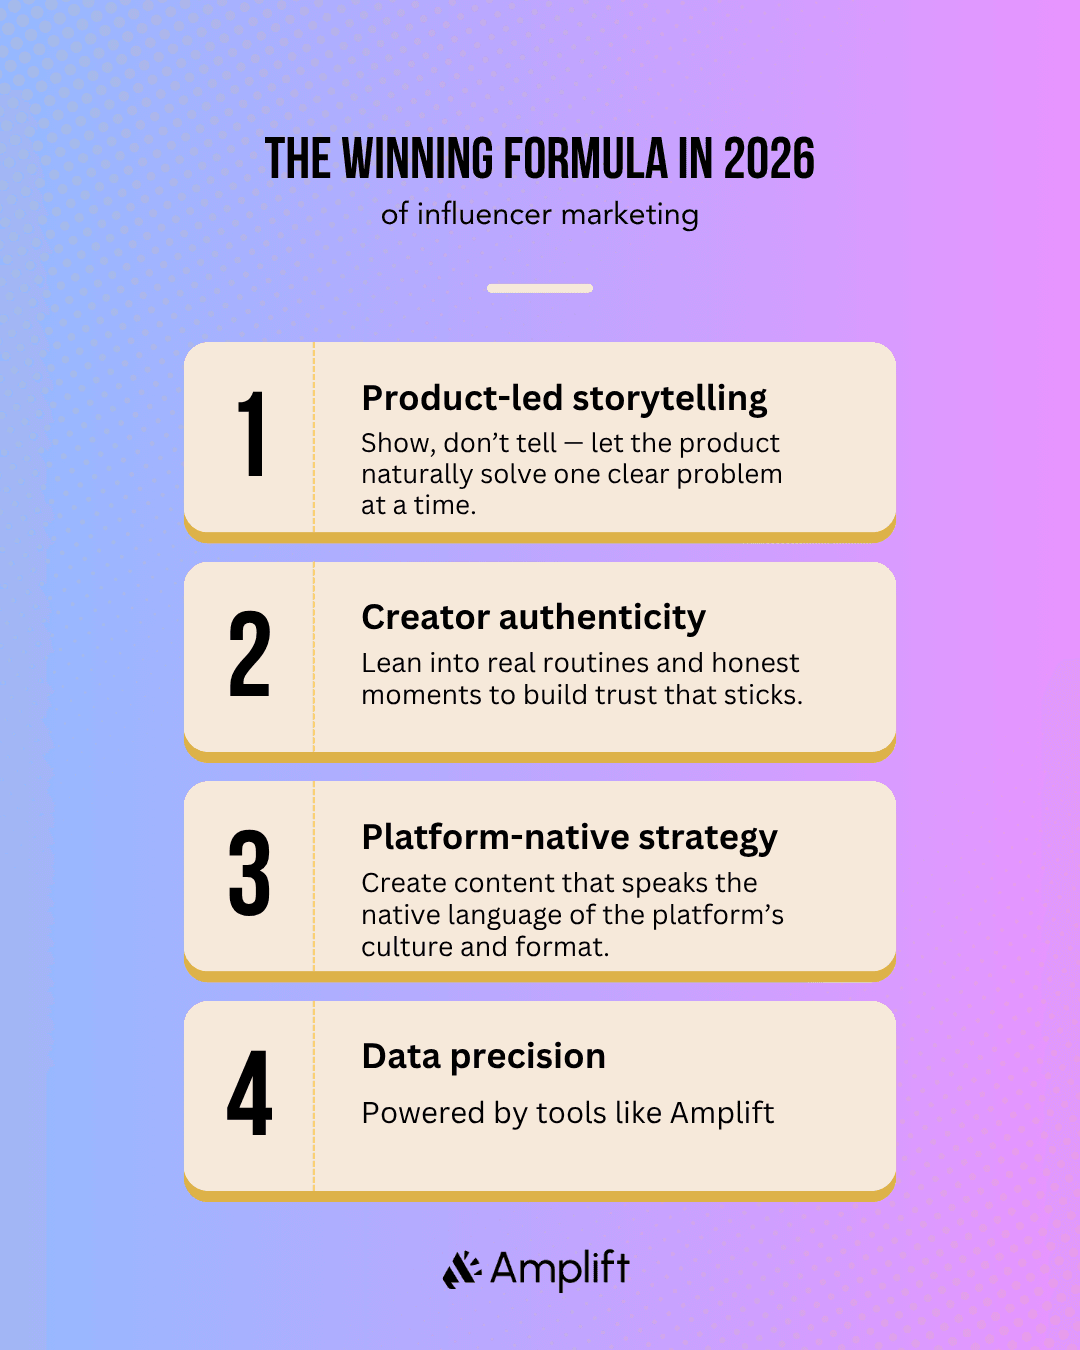
The winning formula lies in combining:
✅ Product-led storytelling
✅ Creator authenticity
✅ Platform-native strategy
✅ Data precision powered by tools like Amplift
Lovable didn’t just go viral — it grew with intention. And Amplift helps you do the same: turning raw influencer chaos into clear, repeatable growth intelligence.
TL;DR — The Lovable Formula (Powered by Amplift)
Product-led storytelling + creator authenticity + platform-native execution + Amplift insight = sustainable, compounding influence.
What This Means for You
Lovable’s growth story isn’t luck — it’s a playbook. Whether you’re building an AI startup, a productivity tool, or a community-first brand, the same principles apply: stay authentic, iterate fast, and let your product tell the story.
With the right data clarity, you can design influencer campaigns that feel organic yet scale with precision — just like Lovable did.
How to Apply This Using Amplift
Amplift helps you uncover and apply the same strategic intelligence that powered Lovable’s rise.
From influencer discovery to campaign tracking, sentiment analysis, and content benchmarking, it turns strategy into clear, actionable insight.
With Amplift, you can:
✅ Find influencers who already align with your niche and tone.
✅ Analyze which platforms and content formats drive the most engagement.
✅ Replicate top-performing strategies across campaigns — data-backed, not guesswork.
✉️ Stay Ahead of the Curve
Join the Amplift Growth Dispatch — monthly drops of influencer benchmarks, campaign frameworks, and case studies just like this one.
🧩 Because growth isn’t magic — it’s architecture.